Fig. 2.
Download original image
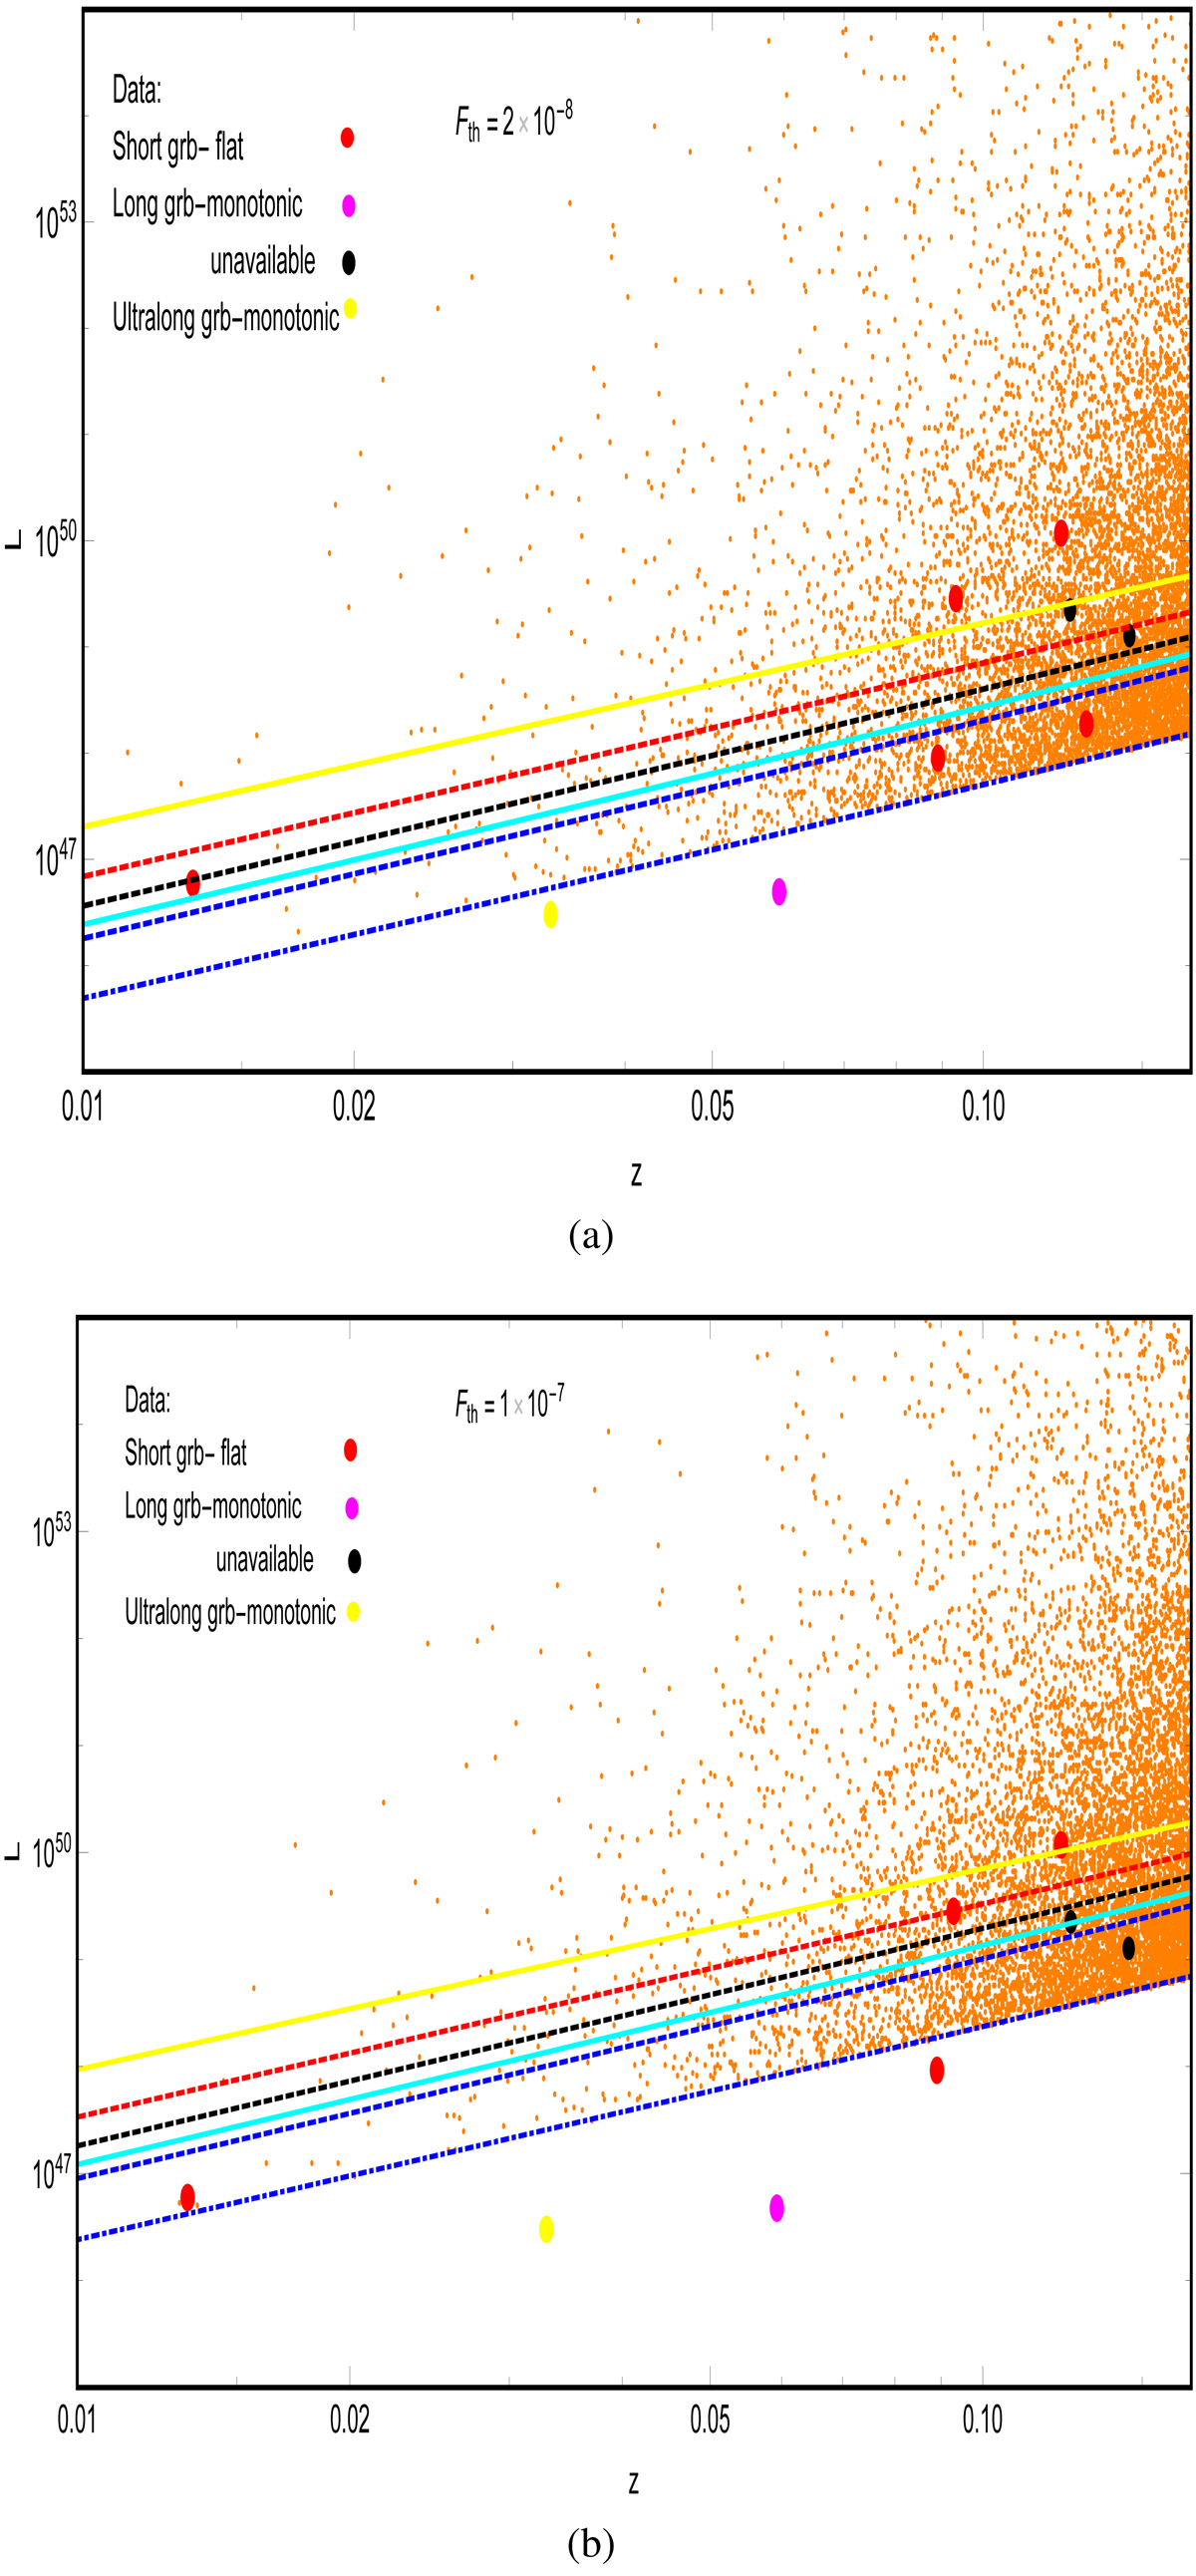
Variation of Lmedian (in erg s−1) with z for small redshifts and comparison with simulated and observed data. Fth is in units of erg cm−2 s−1. The plots in the panel a correspond to Fth = 2 × 10⁻⁸. The plots in panel b correspond to Fth = 1 × 10⁻⁷. The values of the spectral index α are marked on each curve. The orange dots are for simulated data. The larger dots correspond to the observed data for long, short, and ultralong GRBs (Goldstein et al. 2017; Cano et al. 2017; Michałowski et al. 2018; Gehrels et al. 2006; D’Avanzo et al. 2014; Demianski et al. 2017). The green dots are for short GRBs with monotonic afterglow, magenta dots for long GRBs with unavailable afterglow data, and the yellow dots correspond to ultralong GRBs with monotonic afterglow data.
Current usage metrics show cumulative count of Article Views (full-text article views including HTML views, PDF and ePub downloads, according to the available data) and Abstracts Views on Vision4Press platform.
Data correspond to usage on the plateform after 2015. The current usage metrics is available 48-96 hours after online publication and is updated daily on week days.
Initial download of the metrics may take a while.