Fig. 1.
Download original image
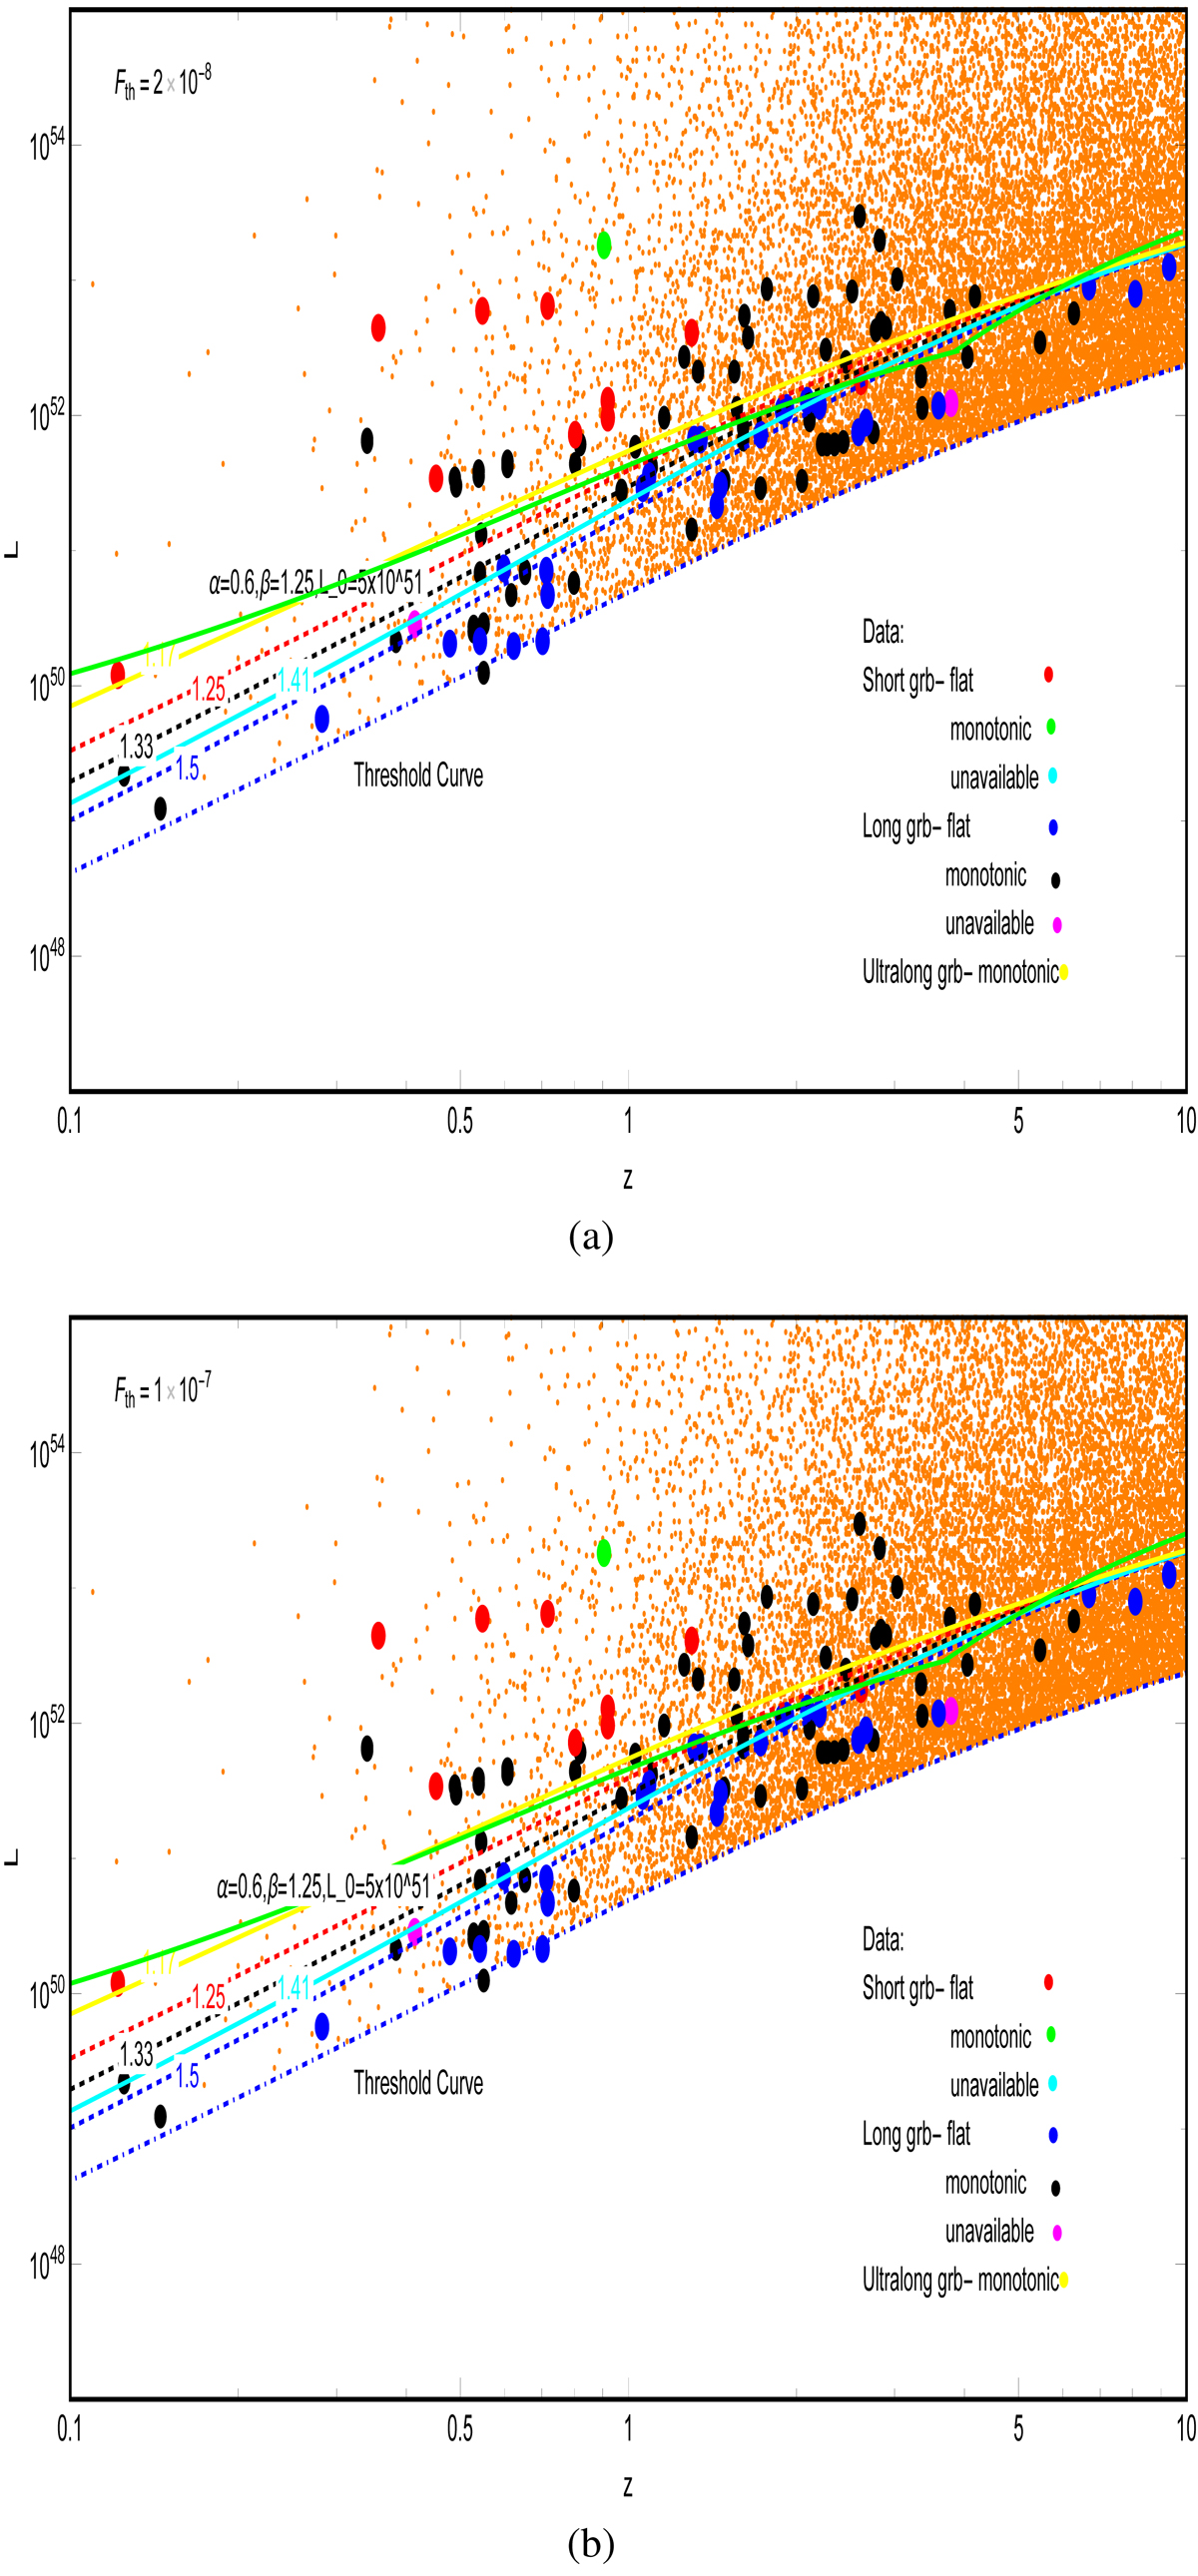
Plot showing the variation of Lmedian (in erg s−1) with z along with observed Swift data and simulated data. The plots in panel a correspond to Fth = 2 × 10⁻⁸ erg cm−2 s−1. The plots in panel b correspond to Fth = 1 × 10⁻⁷ erg cm−2 s−1. The values of the parameters are marked on the plots. The orange dots represent the simulated data. The other, larger dots correspond to the observed data for long, short, and ultralong GRBs (Goldstein et al. 2017; Cano et al. 2017; Michałowski et al. 2018; Gehrels et al. 2006; D’Avanzo et al. 2014; Demianski et al. 2017). The terms monotonic, flat, and unavailable correspond to the nature of afterglow data for the corresponding GRB. The curve marked threshold represents the threshold value (for the rest of the plots in this paper) of L at a given z. For comparison, we also plot the curve (green and brown) corresponding to the ILF given by a broken power law.
Current usage metrics show cumulative count of Article Views (full-text article views including HTML views, PDF and ePub downloads, according to the available data) and Abstracts Views on Vision4Press platform.
Data correspond to usage on the plateform after 2015. The current usage metrics is available 48-96 hours after online publication and is updated daily on week days.
Initial download of the metrics may take a while.