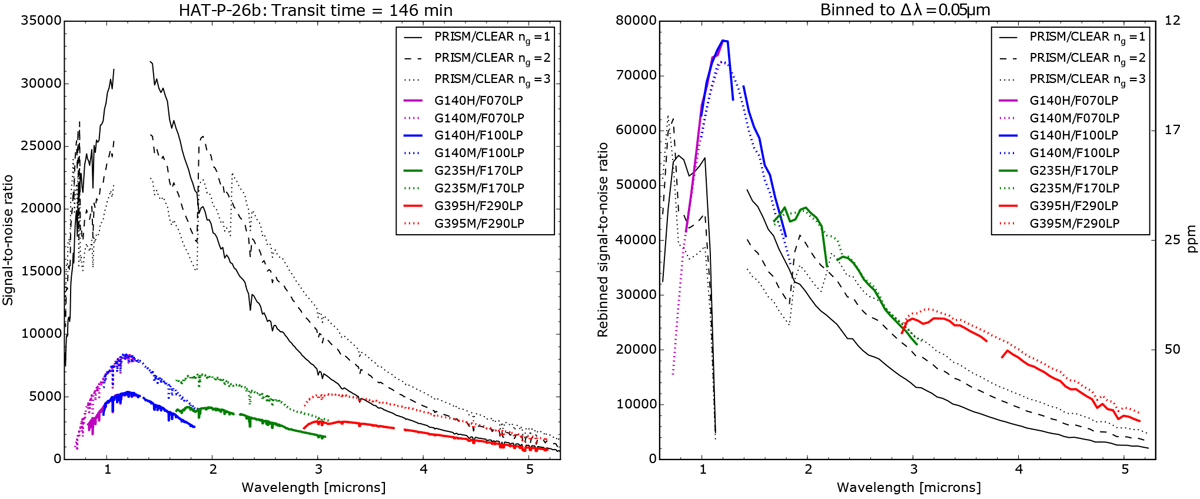
Fig. 8
Download original image
Signal-to-noise ratio for one transit observation (2h26min) of HAT-P-26 b, spending twice that amount of time on baseline out-of-transit observations. Left panel: S/N for the native instrument resolution, and right one is binned in spectral direction to a dispersion of AÀ = 0.05 µm. Calculations are based on a host star with Teff = 5100 K, log(g) = 4.5 and J magnitude 10.80.
Current usage metrics show cumulative count of Article Views (full-text article views including HTML views, PDF and ePub downloads, according to the available data) and Abstracts Views on Vision4Press platform.
Data correspond to usage on the plateform after 2015. The current usage metrics is available 48-96 hours after online publication and is updated daily on week days.
Initial download of the metrics may take a while.