Fig. 3
Download original image
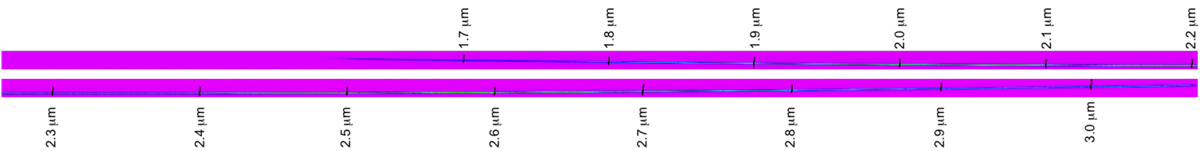
2D unrectifled spectrum of a point source taken with F170LP/G235H and the SUB2048 (32 × 2048) subarray. Top panel: blue part of the spectrum recorded on the NRS1 detector, while bottom panel: red part of the spectrum recorded simultaneously on the NRS2 detector. The slightly slanted (due to slit tilt, see Paper I for details) lines mark the wavelengths.
Current usage metrics show cumulative count of Article Views (full-text article views including HTML views, PDF and ePub downloads, according to the available data) and Abstracts Views on Vision4Press platform.
Data correspond to usage on the plateform after 2015. The current usage metrics is available 48-96 hours after online publication and is updated daily on week days.
Initial download of the metrics may take a while.