Fig. A.3
Download original image
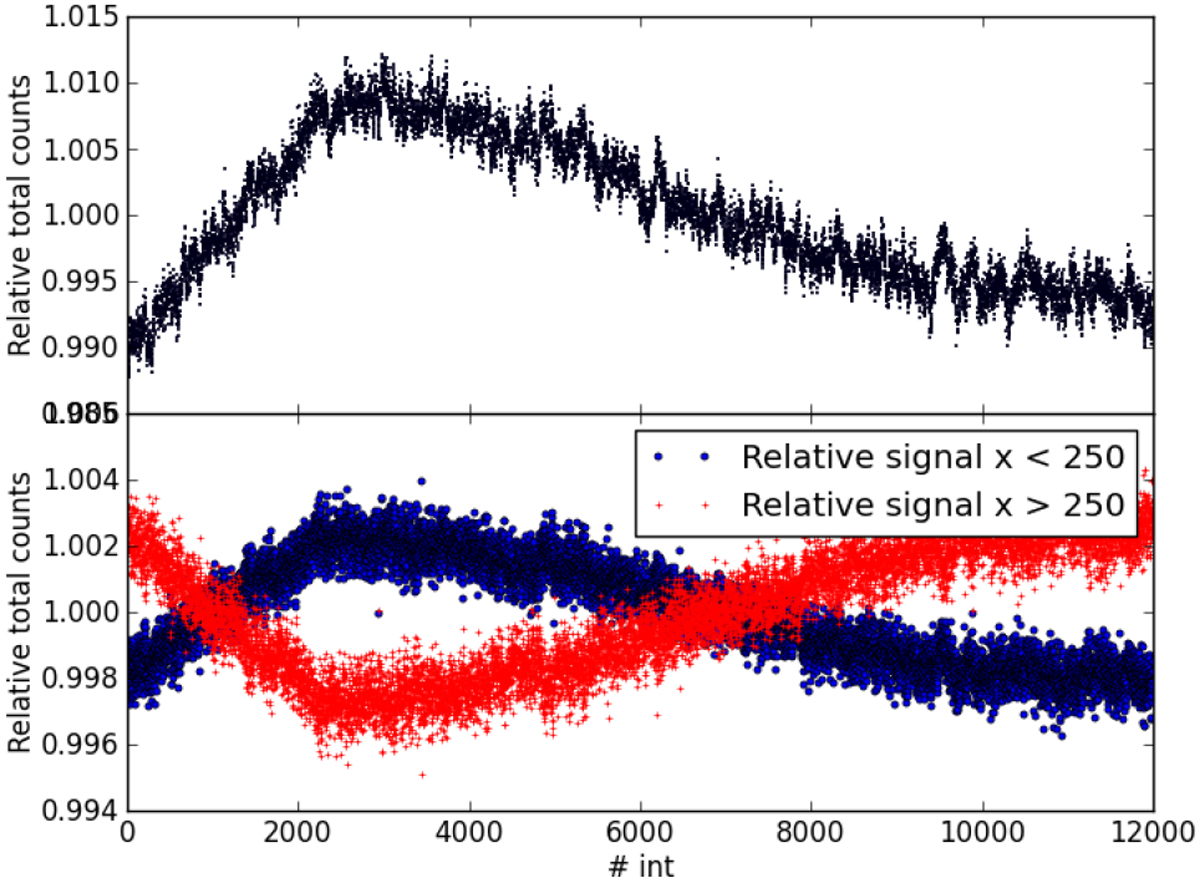
Relative white-light curve for each integration. Obtained by summing up the signal of pixels in the trace and normalizing by the average value over all integrations. Top panel: for all pixels in the trace. Bottom Panel: for pixels in the trace with coordinate in the dispersion direction, x < 250 (blue dots) and x > 250 (red crosses), normalized by the white light curve, so that the values trace the source flux variation in the blue and red part of the spectrum relative to the total flux.
Current usage metrics show cumulative count of Article Views (full-text article views including HTML views, PDF and ePub downloads, according to the available data) and Abstracts Views on Vision4Press platform.
Data correspond to usage on the plateform after 2015. The current usage metrics is available 48-96 hours after online publication and is updated daily on week days.
Initial download of the metrics may take a while.