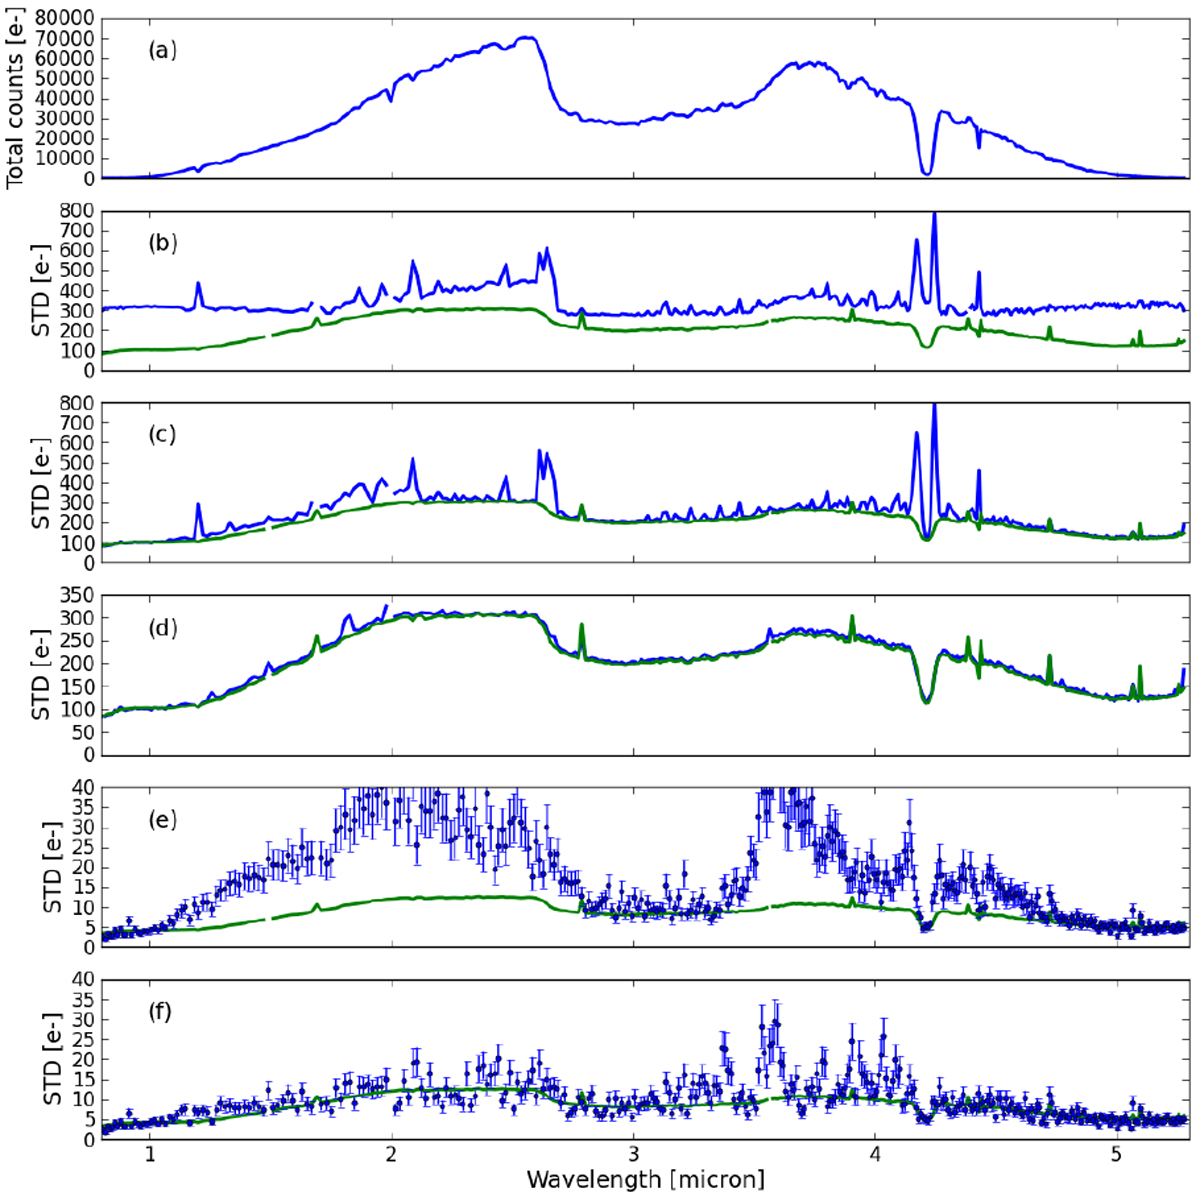
Fig. A.2
Download original image
Spatially collapsed spectrum of the bright point source observed with NIRSpec during ISIM CV3. The signal is shown in panel a, all other panels show the 1σ deviation of each pixel in the collapsed trace. Shown in green is the expected level of 1σ from the statistical noise sources of an ideal instrument and in blue the measured 1σ over the last 9,000 integrations of the three hour long exposure. Panel b shows the 1σ of the raw data, white-light curve normalized; panel c gives 1σ like b, but after image destriping (1/f-noise removal using dark pixels) and flat-fielding; panel d is as c, but after having decorre-lated each pixel signal by the source spatial shifts in x and y direction; panel e is as d, but here the 1σ is computed over 15 (temporal bins) of 600 integrations each, allowing us to reach a higher sensitivity. Error bars on the 1σ are also given. Panel f is as e, but rather than normalizing by the white light-curve, here the data were corrected by a five-color light curve (see text).
Current usage metrics show cumulative count of Article Views (full-text article views including HTML views, PDF and ePub downloads, according to the available data) and Abstracts Views on Vision4Press platform.
Data correspond to usage on the plateform after 2015. The current usage metrics is available 48-96 hours after online publication and is updated daily on week days.
Initial download of the metrics may take a while.