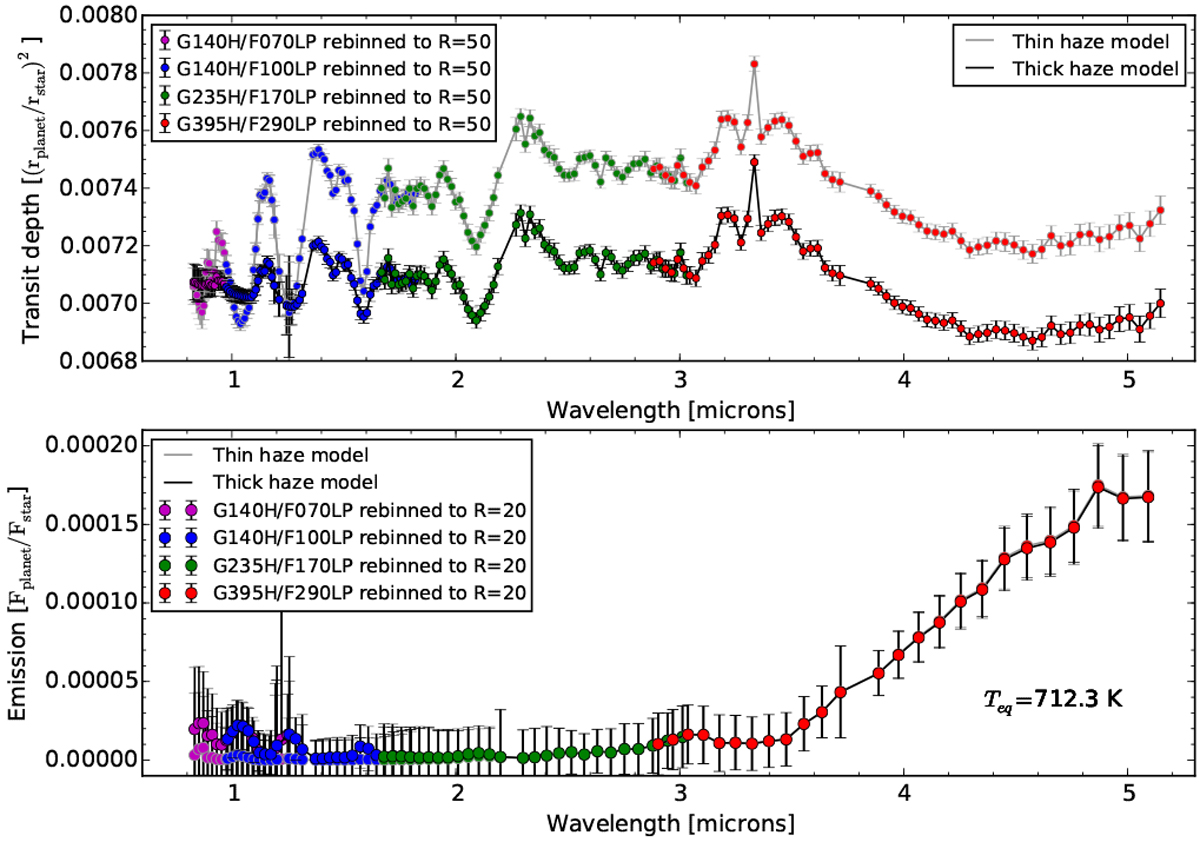
Fig. 10
Download original image
Modeled transit depths and emission spectra for GJ 436 b. The gray curves represent thin and thick atmospheric models and the error bars denote the expected lσ uncertainties for NIRSpec transit and occultation measurements with the high-resolution gratings, after rebinning to the indicated resolution (photon and read noise only).
Current usage metrics show cumulative count of Article Views (full-text article views including HTML views, PDF and ePub downloads, according to the available data) and Abstracts Views on Vision4Press platform.
Data correspond to usage on the plateform after 2015. The current usage metrics is available 48-96 hours after online publication and is updated daily on week days.
Initial download of the metrics may take a while.