Fig. B.1
Download original image
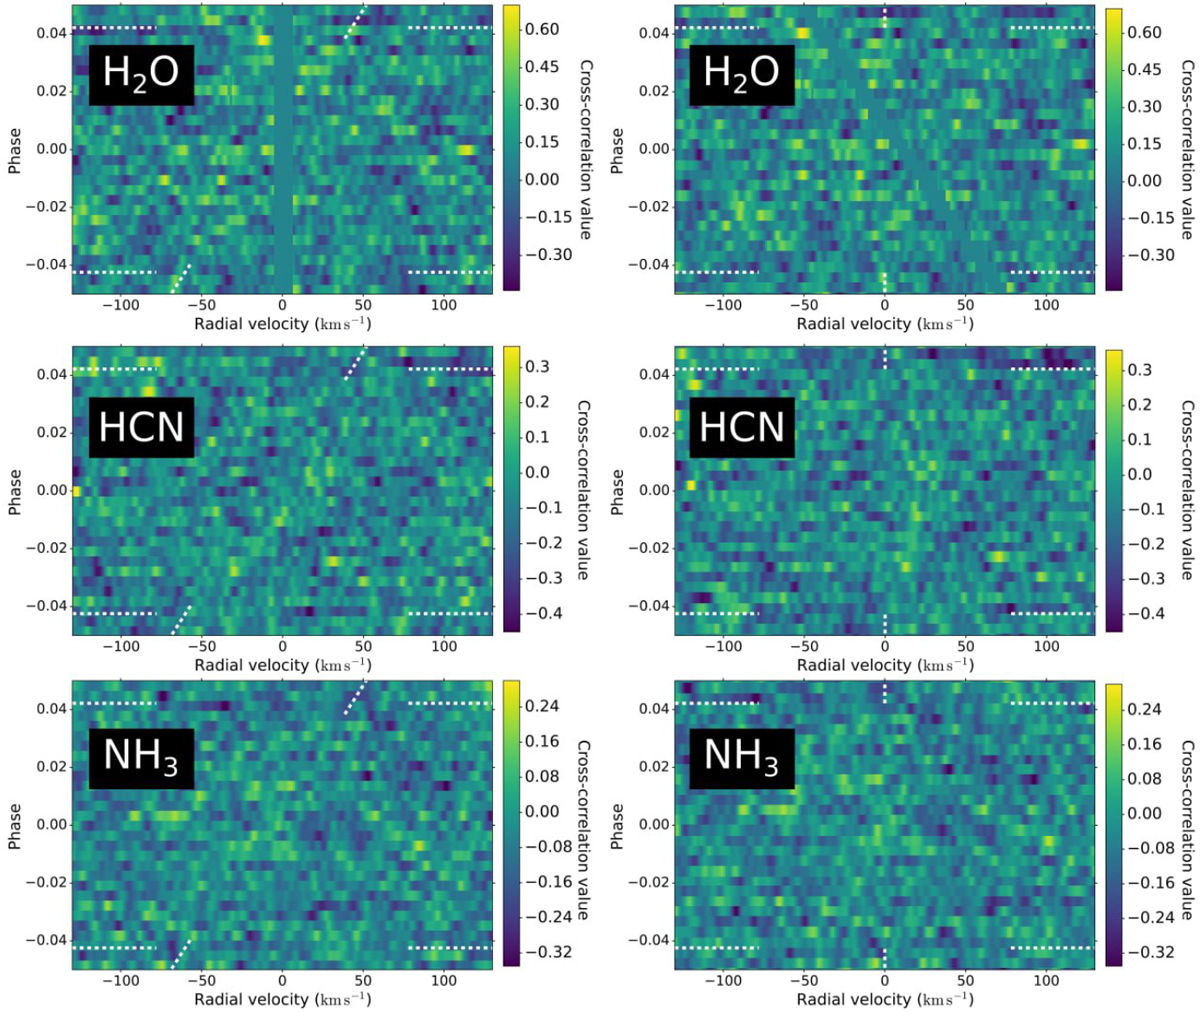
Cross-correlation matrices obtained by following the methods discussed in Sect. 2. Left column: Cross-correlation matrices in the Earth rest frame. The tilted dashed lines mark the exoplanet velocities. Right column: Cross-correlation matrices in the exoplanet rest-frame (KP ~ 196 km s−1). In this case, the exoplanet velocities are constantly 0 km s−1 (vertical dashed lines). In all plots, the transit occurs between the horizontal dashed lines.
Current usage metrics show cumulative count of Article Views (full-text article views including HTML views, PDF and ePub downloads, according to the available data) and Abstracts Views on Vision4Press platform.
Data correspond to usage on the plateform after 2015. The current usage metrics is available 48-96 hours after online publication and is updated daily on week days.
Initial download of the metrics may take a while.