Fig. 2
Download original image
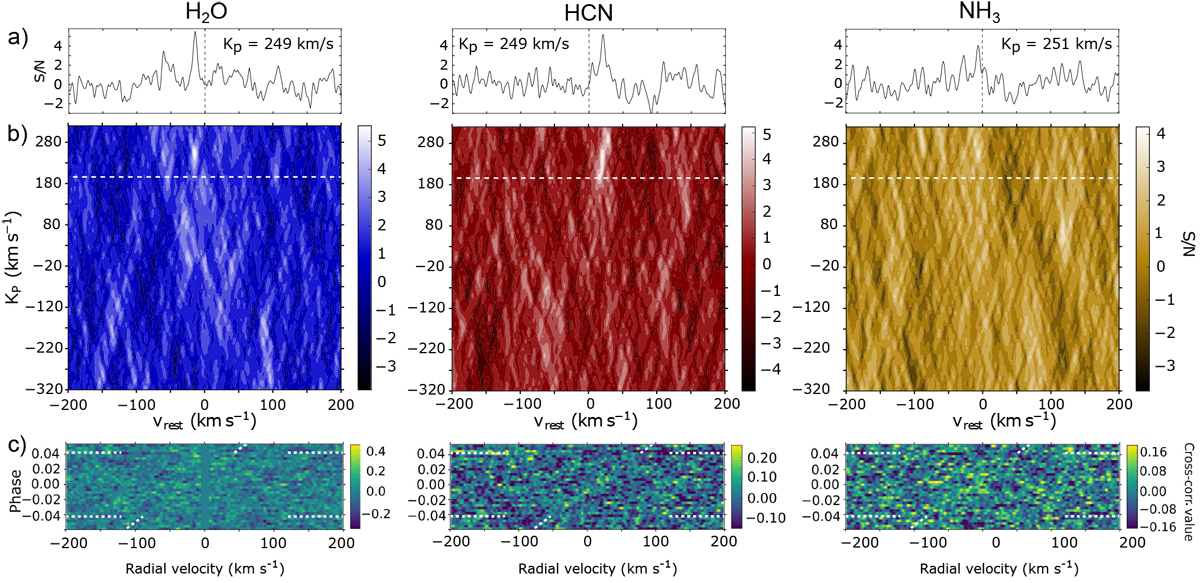
Results of the cross-correlation analyses. (a) CCFs at the KP presenting the maximum significance peak. (b) Cross-correlation maps (expressed as S/N) of potential signals for H2O (left), HCN (middle), and NH3 (right) with respect to the exoplanet rest-frame velocity (horizontal axis) and KP (vertical axis). The horizontal dashed lines mark the expected KP of WASP-76 b (~196 km s−1). (c) Cross-correlation matrices in the Earth rest-frame. The transit occurs between the horizontal dashed lines and the tilted dashed lines mark the velocities of the highest significance signal. Larger versions of the cross-correlation matrices in the Earth’s rest frame and in the rest-frame of the exoplanet are shown in Appendix B.
Current usage metrics show cumulative count of Article Views (full-text article views including HTML views, PDF and ePub downloads, according to the available data) and Abstracts Views on Vision4Press platform.
Data correspond to usage on the plateform after 2015. The current usage metrics is available 48-96 hours after online publication and is updated daily on week days.
Initial download of the metrics may take a while.