Fig. 6
Download original image
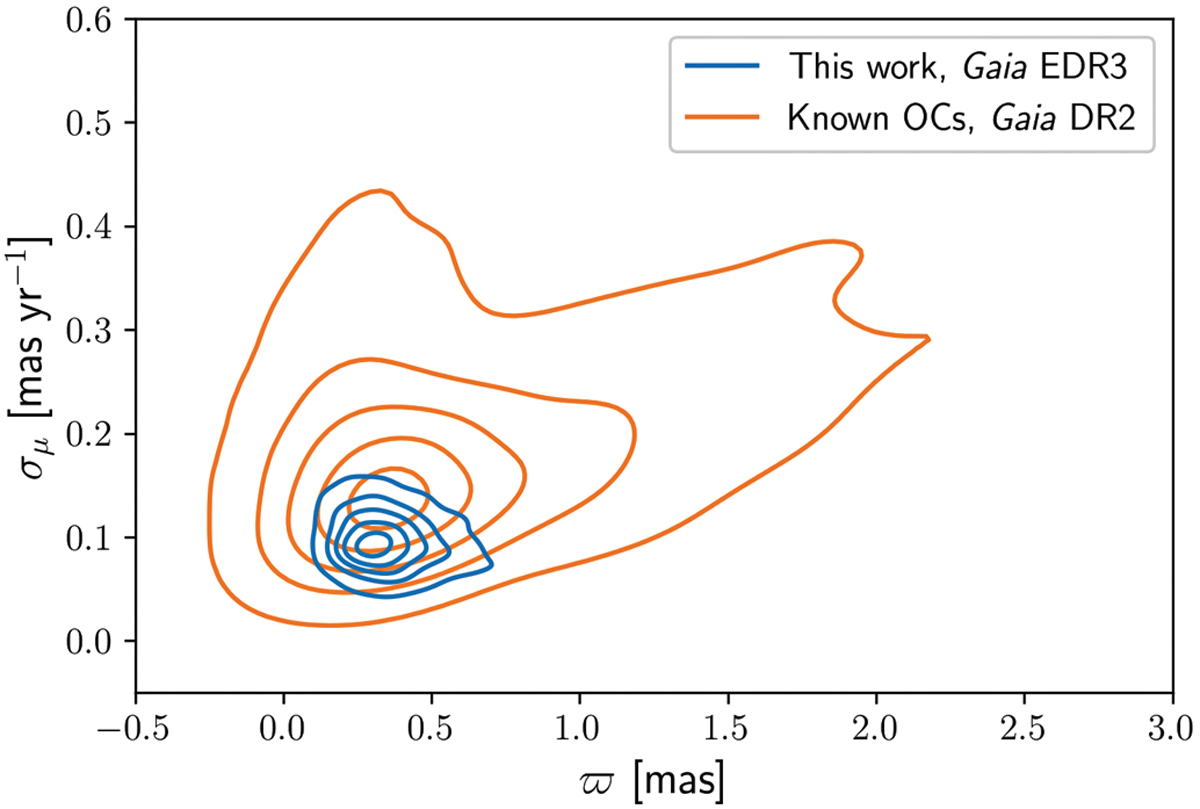
Total proper motion dispersion ![]() as a function of parallax. The orange lines show the OC density contours for the OC characterised with Gaia DR2 (Cantat-Gaudin et al. 2020). The blue lines show the same OC density contours for the OCs detected in this study using Gaia EDR3. The density contours are at the 10, 30, 50, 70, and 90% levels.
as a function of parallax. The orange lines show the OC density contours for the OC characterised with Gaia DR2 (Cantat-Gaudin et al. 2020). The blue lines show the same OC density contours for the OCs detected in this study using Gaia EDR3. The density contours are at the 10, 30, 50, 70, and 90% levels.
Current usage metrics show cumulative count of Article Views (full-text article views including HTML views, PDF and ePub downloads, according to the available data) and Abstracts Views on Vision4Press platform.
Data correspond to usage on the plateform after 2015. The current usage metrics is available 48-96 hours after online publication and is updated daily on week days.
Initial download of the metrics may take a while.