Fig. 2
Download original image
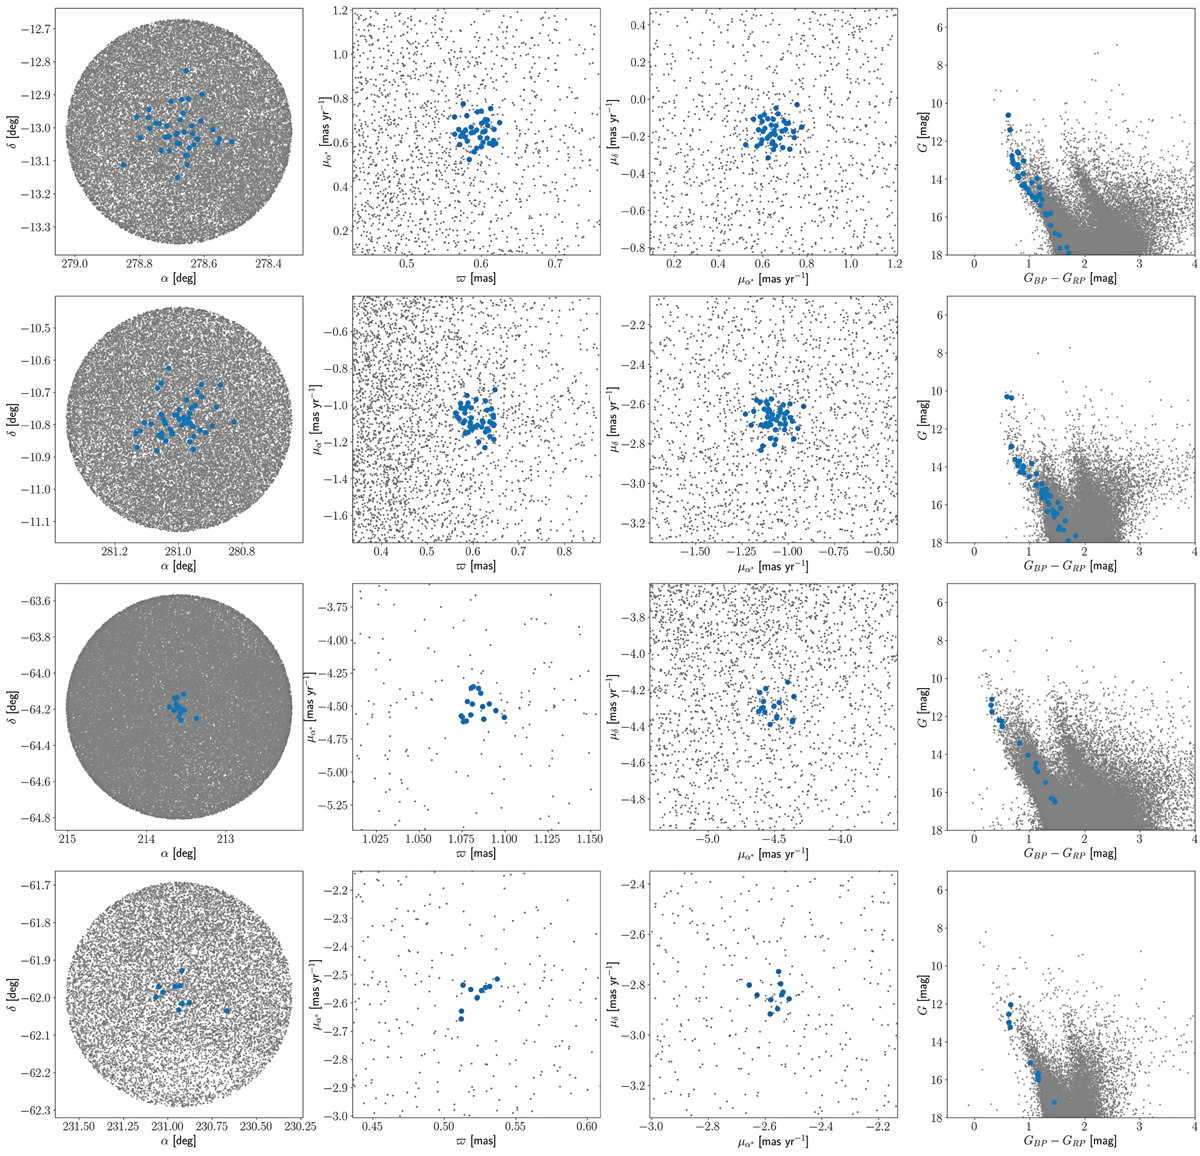
Examples of the detected OCs for the different classes. The blue dots represent the detected member stars for each OC, while the grey dots are field stars queried in the Gaia archive using a cone search within 10 pc radius at the distance of the OC. From left to right, different panels represent: (i) positional distribution in α, δ, (ii) ![]() versus
versus ![]() distribution, (iii) proper motion diagram, and (iv) the CMD. From top to bottom, different rows are for different OCs: (i) UBC 1023 and UBC 1029 from class A, (ii) UBC 1592 from class B, and (ii) UBC 1628 from class C.
distribution, (iii) proper motion diagram, and (iv) the CMD. From top to bottom, different rows are for different OCs: (i) UBC 1023 and UBC 1029 from class A, (ii) UBC 1592 from class B, and (ii) UBC 1628 from class C.
Current usage metrics show cumulative count of Article Views (full-text article views including HTML views, PDF and ePub downloads, according to the available data) and Abstracts Views on Vision4Press platform.
Data correspond to usage on the plateform after 2015. The current usage metrics is available 48-96 hours after online publication and is updated daily on week days.
Initial download of the metrics may take a while.