Fig. 11
Download original image
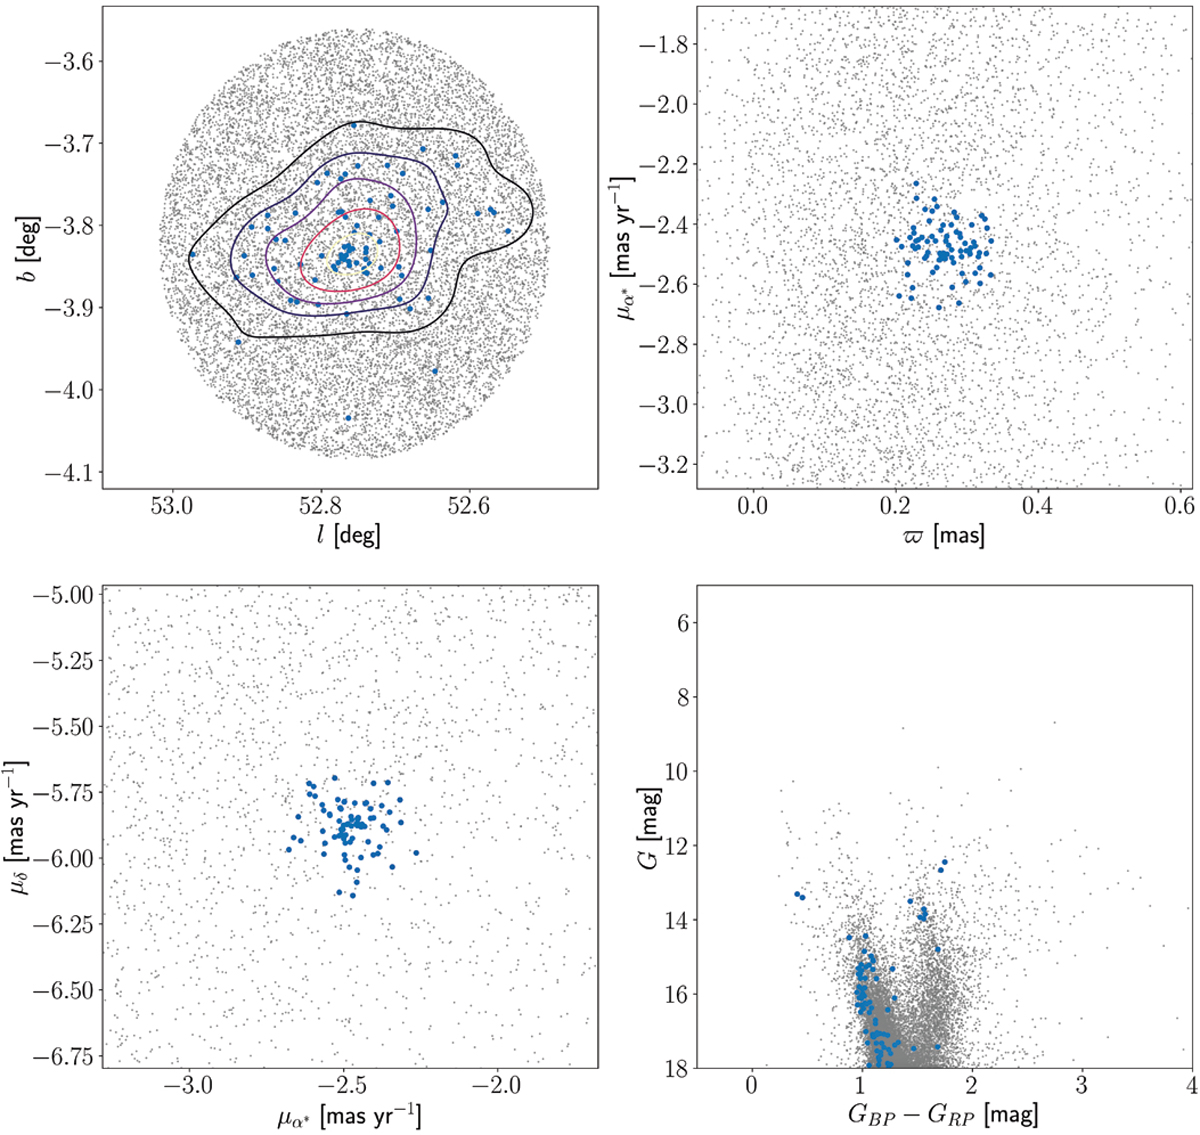
Diagrams for UBC 1061. The blue dots are the stars selected as members with our OCfinder method, while the grey dots are field stars around 15 pc from the cluster centre. The diagrams correspond to the sky distribution, with density contour plots (top left), ![]() versus
versus ![]() (top right), proper motion diagram (bottom left), and the CMD (bottom right).
(top right), proper motion diagram (bottom left), and the CMD (bottom right).
Current usage metrics show cumulative count of Article Views (full-text article views including HTML views, PDF and ePub downloads, according to the available data) and Abstracts Views on Vision4Press platform.
Data correspond to usage on the plateform after 2015. The current usage metrics is available 48-96 hours after online publication and is updated daily on week days.
Initial download of the metrics may take a while.