Free Access
Fig. 1
Download original image
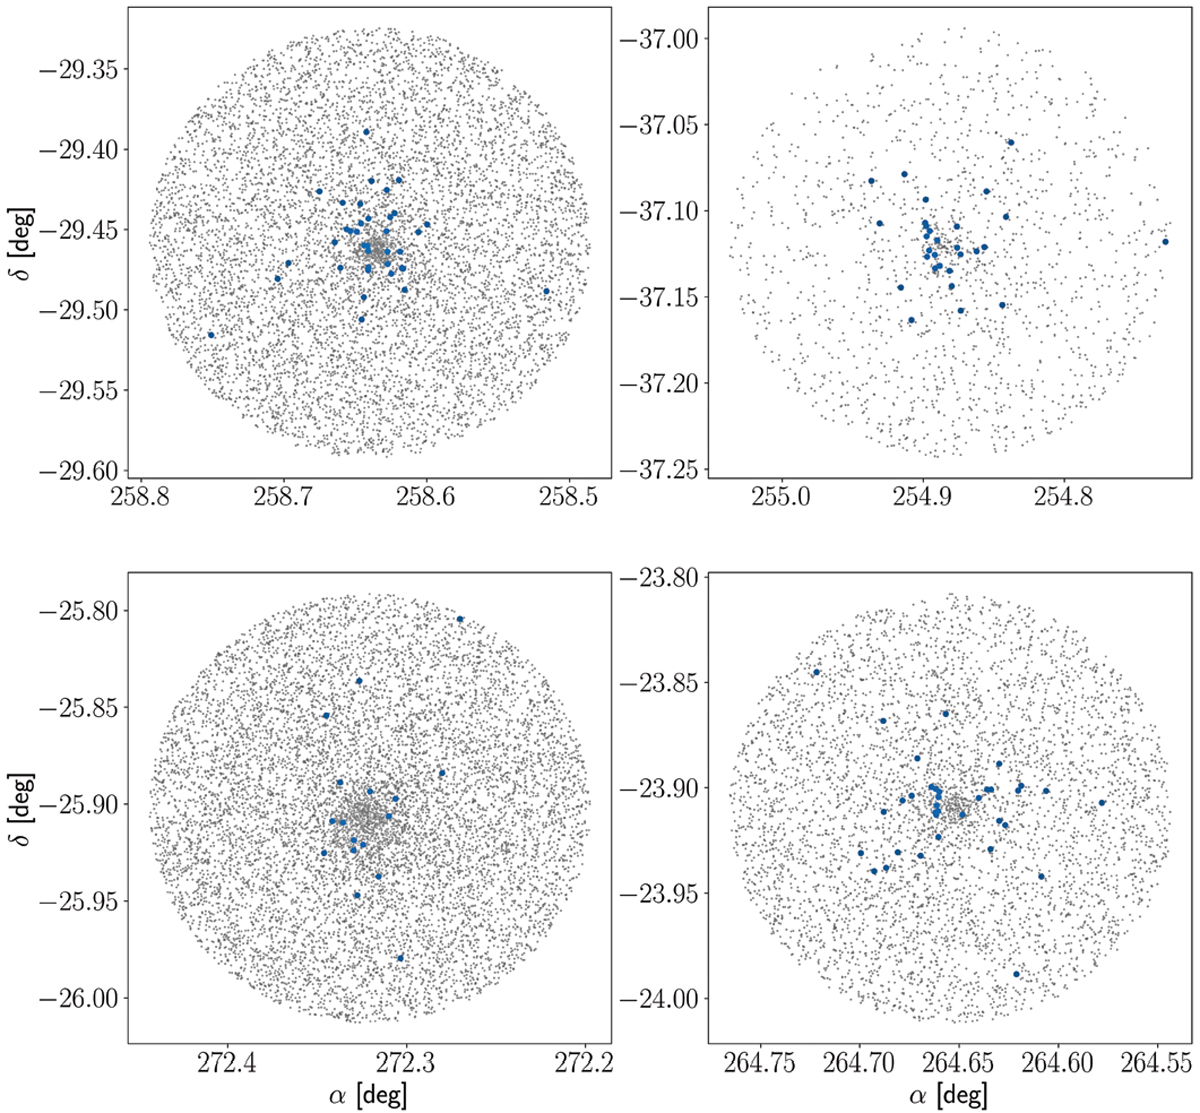
Distribution in α and δ for GCs NGC 6304 (top left), NGC 6256 (top right), NGC 6553 (bottom left), and NGC 6401 (bottom right). The blue dots represent the stars found as overdensities with OCfinder, while grey dots are all stars in a cone search around the GC centre.
Current usage metrics show cumulative count of Article Views (full-text article views including HTML views, PDF and ePub downloads, according to the available data) and Abstracts Views on Vision4Press platform.
Data correspond to usage on the plateform after 2015. The current usage metrics is available 48-96 hours after online publication and is updated daily on week days.
Initial download of the metrics may take a while.