Fig. 6.
Download original image
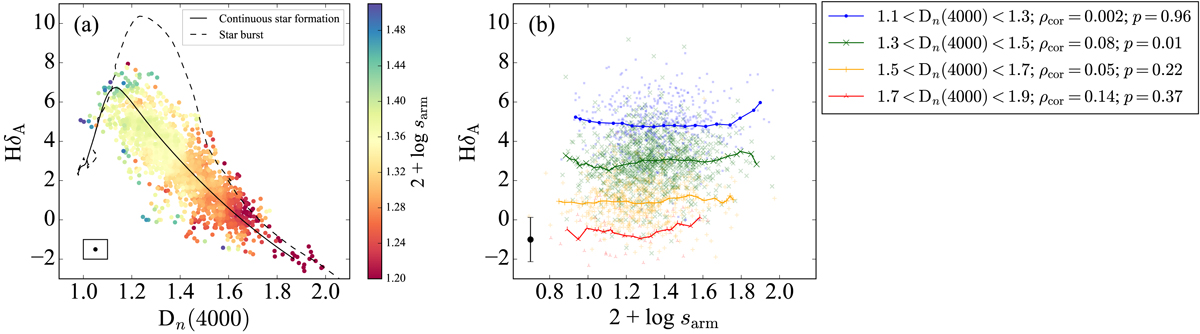
HδA plotted as a function of Dn(4000) and spiral arm strength (2 + log sarm). Panels a: the color associated with each data point encodes the average arm strength of the surrounding galaxies with |Δx|≤0.05 and |Δy|≤0.5 (the box is illustrated in the bottom-left corner). The curves show evolution tracks obtained using the GALAXEV stellar population synthesis code (Bruzual & Charlot 2003) with the provided simple stellar population model of a metallicity Z = 0.019 and a Chabrier (2003) initial mass function. Dashed and solid curves respectively show results for an instantaneous burst of star formation and continuous star formation that declines exponentially with time with a characteristic timescale of 4 Gyr. Panel b: the color encodes the different narrow ranges of Dn(4000). The typical scatter in HδA at a given 2 + log sarm and a given Dn(4000) is illustrated in the bottom-left corner.
Current usage metrics show cumulative count of Article Views (full-text article views including HTML views, PDF and ePub downloads, according to the available data) and Abstracts Views on Vision4Press platform.
Data correspond to usage on the plateform after 2015. The current usage metrics is available 48-96 hours after online publication and is updated daily on week days.
Initial download of the metrics may take a while.