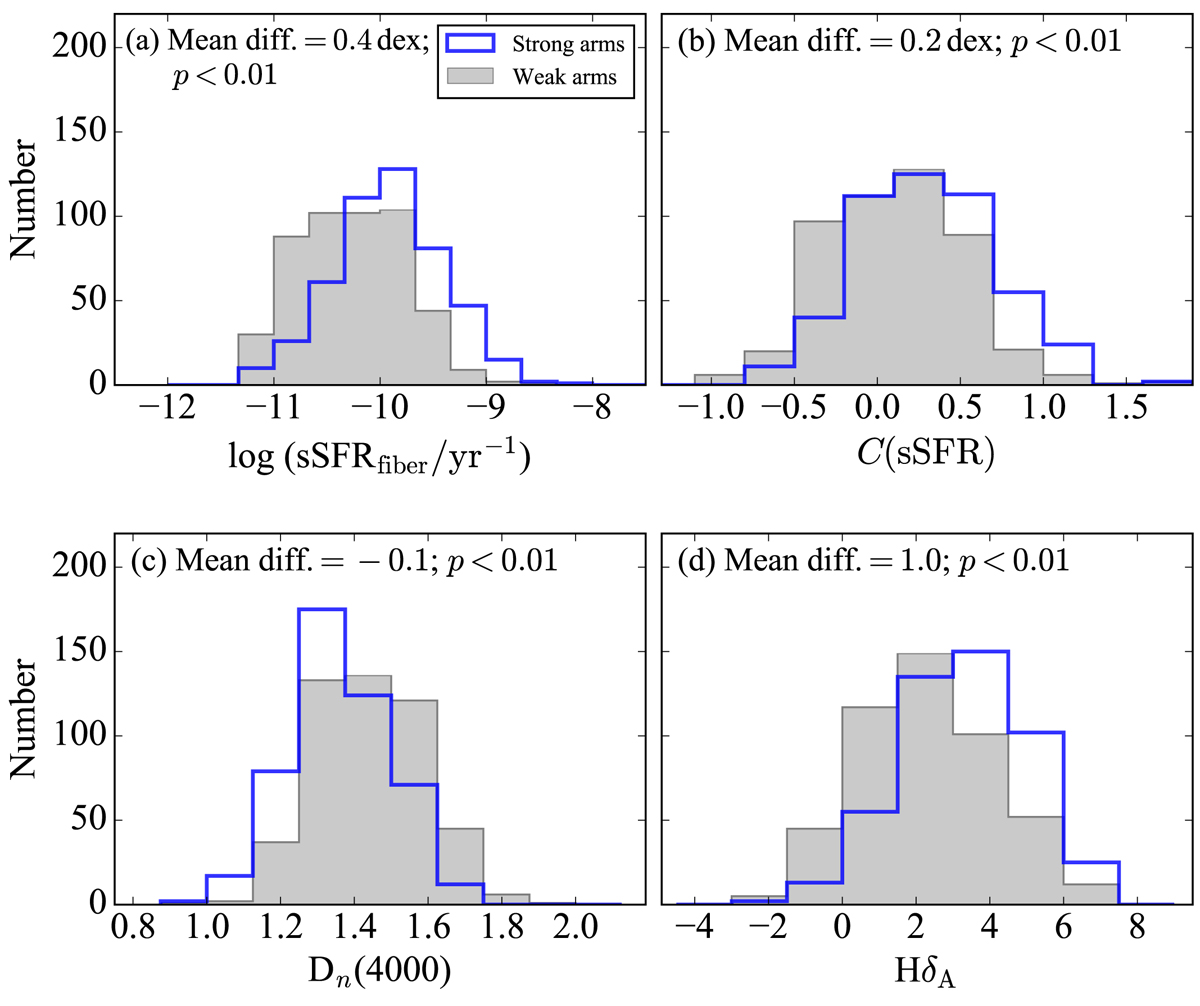
Fig. 5.
Download original image
Distribution of central SFR indicators for galaxies with strong arms and the control sample with weak arms. Panels a–d: show the result of sSFRfiber, C(sSFR), Dn(4000), and HδA, respectively. The distributions for strong-armed galaxies are marked in blue, and the same for the control weak-armed sample are marked in gray. The mean difference between the two distributions and p values from the Kolmogorov–Smirnov test are presented at the top of each panel.
Current usage metrics show cumulative count of Article Views (full-text article views including HTML views, PDF and ePub downloads, according to the available data) and Abstracts Views on Vision4Press platform.
Data correspond to usage on the plateform after 2015. The current usage metrics is available 48-96 hours after online publication and is updated daily on week days.
Initial download of the metrics may take a while.