Fig. 4.
Download original image
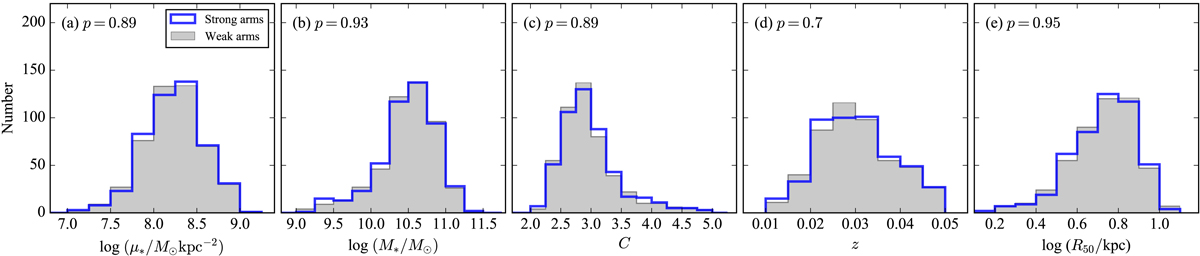
Distribution of the parameters used to construct the control sample. Panels a–d: show the distribution of stellar surface density (logμ*), stellar mass (log M*), concentration (C), redshift (z), and effective radius (log R50), respectively. Results for galaxies with strong spiral arms (2 + log sarm ≥ 1.44) are marked in blue histogram, and the same for the control sample with weak spiral arms (2 + log sarm < 1.44) are marked in gray filled histogram. The p value of the Kolmogorov–Smirnov test is presented at the top of each panel.
Current usage metrics show cumulative count of Article Views (full-text article views including HTML views, PDF and ePub downloads, according to the available data) and Abstracts Views on Vision4Press platform.
Data correspond to usage on the plateform after 2015. The current usage metrics is available 48-96 hours after online publication and is updated daily on week days.
Initial download of the metrics may take a while.