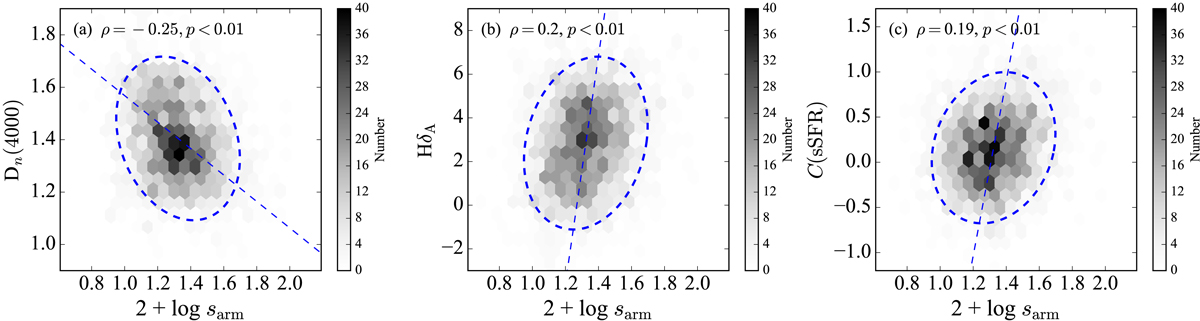
Fig. 3.
Download original image
Dependence of central SFR indicators on spiral arm strength (2 + log sarm). Panels a–c: plot the Dn(4000), HδA, and C(sSFR) against arm strength, respectively. The bin color encodes the number of galaxies in each bin, scaled by the color bar next to the panel. The Pearson correlation coefficient and the corresponding p value are denoted at the top. The confidence ellipses are obtained using the PCA technique described in the text, and they contain approximately 95% of the data. As these ellipses could be distorted due to the different dynamical ranges of the x and y axes, a best-fitted straight line indicating the direction of main principal component is plotted.
Current usage metrics show cumulative count of Article Views (full-text article views including HTML views, PDF and ePub downloads, according to the available data) and Abstracts Views on Vision4Press platform.
Data correspond to usage on the plateform after 2015. The current usage metrics is available 48-96 hours after online publication and is updated daily on week days.
Initial download of the metrics may take a while.