Fig. 2.
Download original image
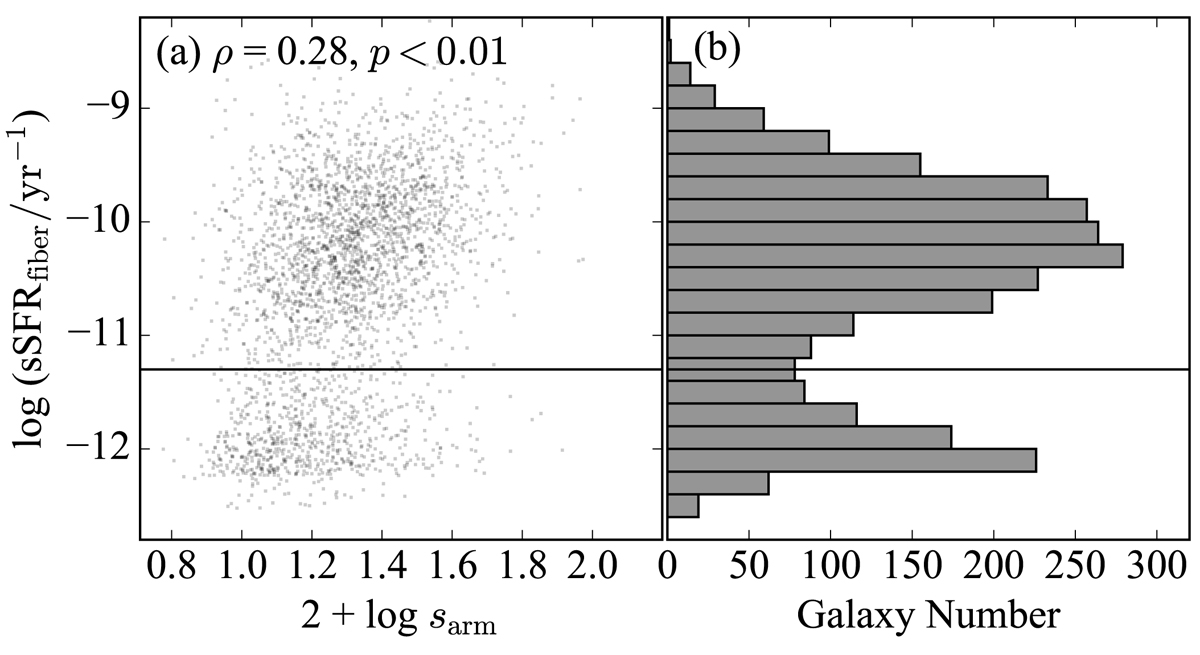
Dependence of central sSFR (sSFRfiber) on strength of spiral arms (2 + log sarm). Panel a: the scatter plot of the two parameters. Panel b: shows the number distribution of sSFRfiber. The solid horizon line (logsSFRfiber = −11.3) marks the valley of the number distribution, separating the sample into centrally star-forming and centrally quenched SFMS galaxies. The Pearson correlation coefficient between sSFRfiber and 2 + log sarm is denoted at the top.
Current usage metrics show cumulative count of Article Views (full-text article views including HTML views, PDF and ePub downloads, according to the available data) and Abstracts Views on Vision4Press platform.
Data correspond to usage on the plateform after 2015. The current usage metrics is available 48-96 hours after online publication and is updated daily on week days.
Initial download of the metrics may take a while.