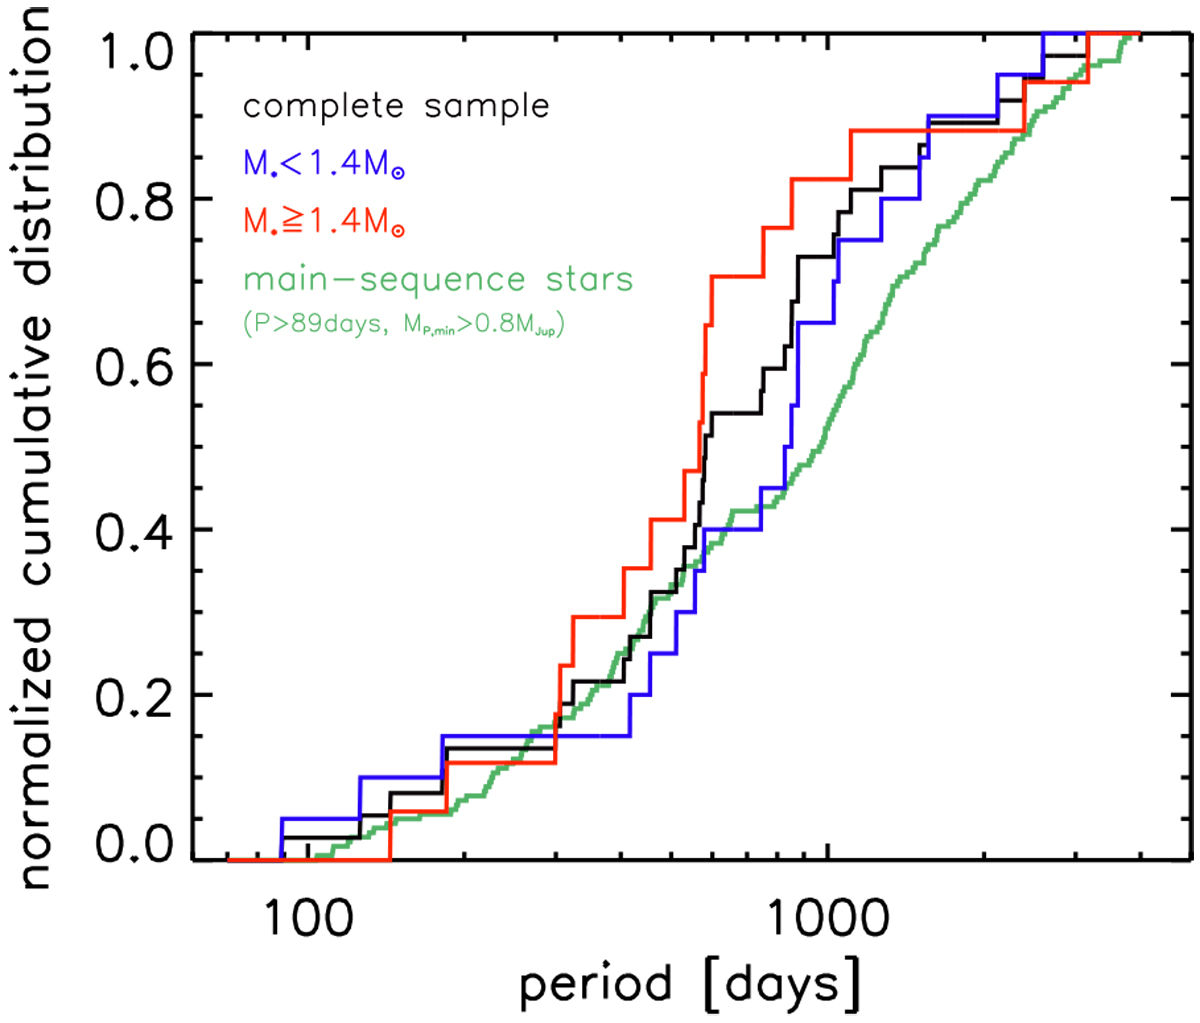
Fig. 9
Download original image
Normalized cumulative distribution of orbital periods for planets with MPsin(i) ≥ 0.8 MJup. The black line corresponds to the entire sample, while the blue and red line show the distribution for subsam-ples with M, < 1.4 M⊙ and M* ≥ 1.4 M⊙, respectively. For comparison, the distribution for giant planets orbiting main-sequence stars with MP sin(i) ≥ 0.8 MJup and P > 89 days is shown (obtained from the NASA Exoplanet Archive, selecting only planets discovered via RV and around host stars with log(ɡ) ≥ 4).
Current usage metrics show cumulative count of Article Views (full-text article views including HTML views, PDF and ePub downloads, according to the available data) and Abstracts Views on Vision4Press platform.
Data correspond to usage on the plateform after 2015. The current usage metrics is available 48-96 hours after online publication and is updated daily on week days.
Initial download of the metrics may take a while.