Fig. 8
Download original image
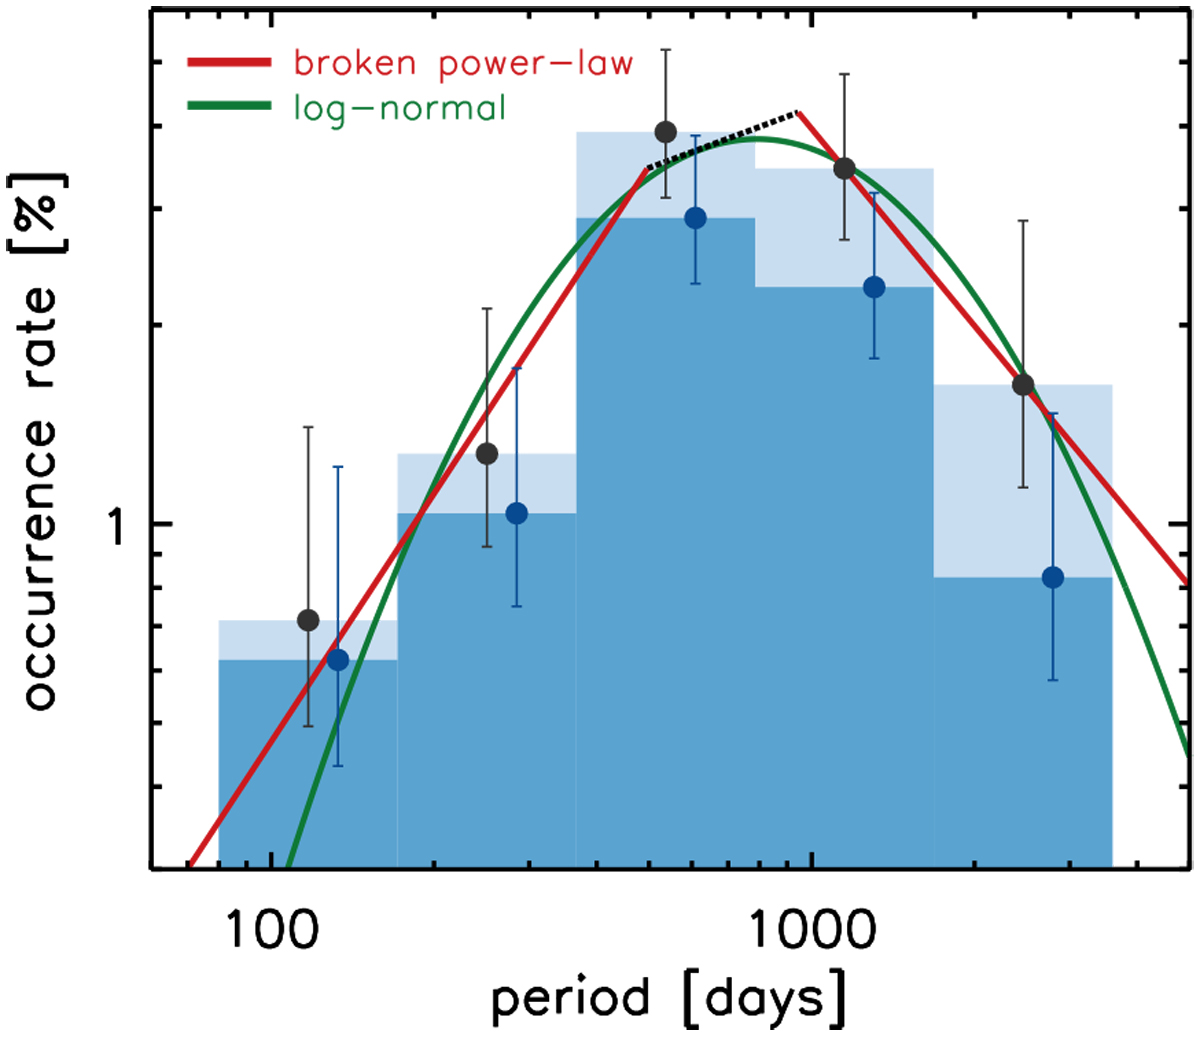
Planet occurrence rate for planets with MP sin(i) > 0.8 MJup in five period bins. The blue histogram and blue dots correspond to the uncorrected rate, while the light blue histogram and black dots show the rate corrected for missed planets. Errors are derived from the binomial distribution. The log-normal fit is plotted in green, while the best-fit broken power-law is shown in red with a black dotted connector illustrating the 1σ uncertainty in Pbreak.
Current usage metrics show cumulative count of Article Views (full-text article views including HTML views, PDF and ePub downloads, according to the available data) and Abstracts Views on Vision4Press platform.
Data correspond to usage on the plateform after 2015. The current usage metrics is available 48-96 hours after online publication and is updated daily on week days.
Initial download of the metrics may take a while.