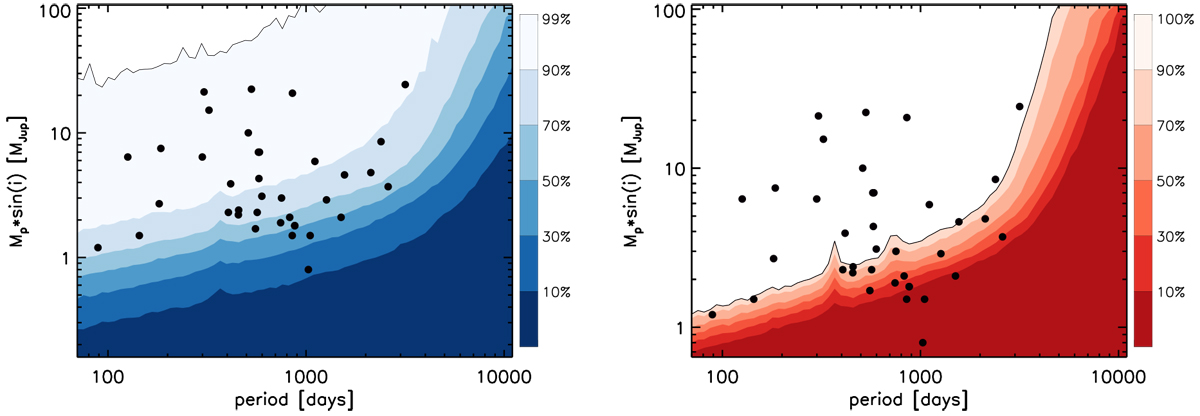
Fig. 6
Download original image
Two different ways to visualize detectability within the survey. Detected planets (see Table 1) are plotted in black. Left: global detection efficiency of the combined survey in period-planet mass space. Planets with Mp sin(i) above the, e.g., 50% limit can be detected around 50% of the stars in the sample at the given period. Right: median detection probabilities of the combined survey in period-planet mass space (the 50% median probability curve is computed by determining the median of all individual stars’ 50% level at each period). Planets with Mp sin(i) above the 50% limit have a median detection probability of 50% across the sample at the given period.
Current usage metrics show cumulative count of Article Views (full-text article views including HTML views, PDF and ePub downloads, according to the available data) and Abstracts Views on Vision4Press platform.
Data correspond to usage on the plateform after 2015. The current usage metrics is available 48-96 hours after online publication and is updated daily on week days.
Initial download of the metrics may take a while.