Fig. 5
Download original image
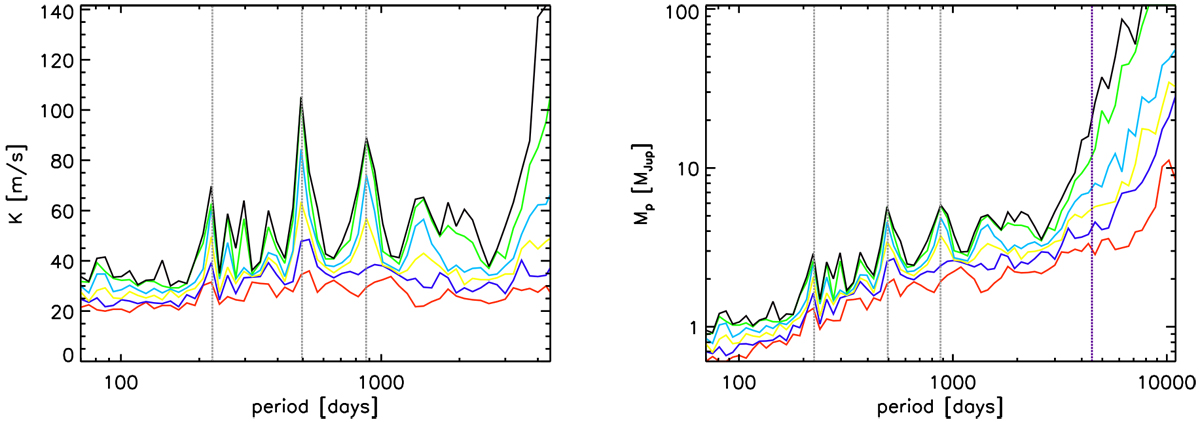
Detection probability map for a target star affected by quasi-periodic oscillations; it exhibits three peaks (at 224d, 496d, and 875d) with FAP< 1% in the GLS periodogram; left: in period-RV semi-amplitude space, and right: in period-planet mass space. The black, green, light blue, yellow, blue, and red solid lines correspond to detection probabilities of 100%, 90%, 70%, 50%, 30%, and 10%, respectively. The detection probability level of, e.g., 10% gives the semi-amplitude (or planet mass) at which 10% of the tested phases can be recovered at the given period. The vertical black dotted lines show the positions of the three significant periodicities, while the vertical dashed blue line in the right plot delineates the time base line of observations for this star (the left plot is restricted to the time base line for better visibility).
Current usage metrics show cumulative count of Article Views (full-text article views including HTML views, PDF and ePub downloads, according to the available data) and Abstracts Views on Vision4Press platform.
Data correspond to usage on the plateform after 2015. The current usage metrics is available 48-96 hours after online publication and is updated daily on week days.
Initial download of the metrics may take a while.