Fig. 4
Download original image
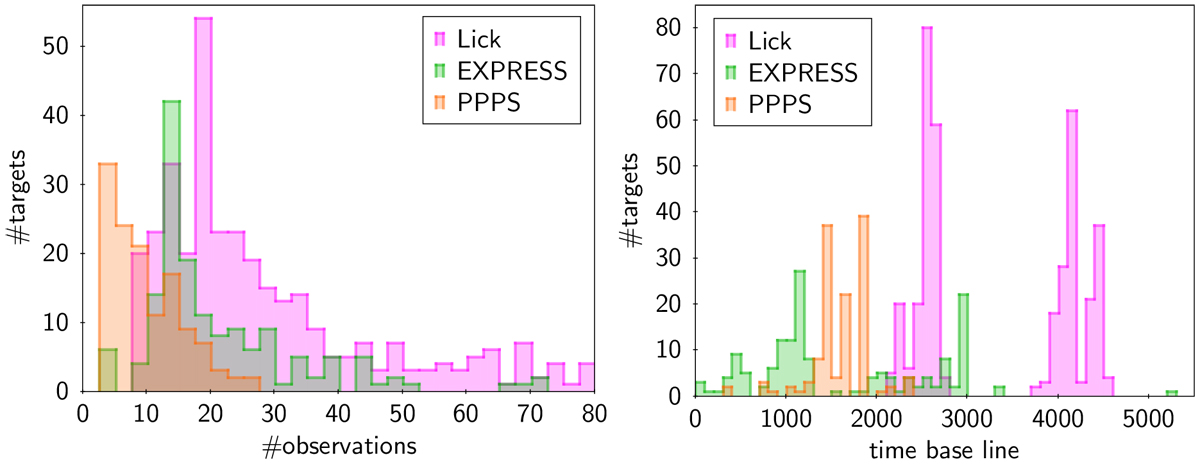
Histograms to illustrate the inhomogeneous observational histories among all stars of the three surveys. Lick, EXPRESS, and PPPS are shown in violet, green, and orange, respectively. Left: distribution of the number of radial velocity data points per star. Right: distribution of the time base line, i.e., the time span covered by RV observations per star.
Current usage metrics show cumulative count of Article Views (full-text article views including HTML views, PDF and ePub downloads, according to the available data) and Abstracts Views on Vision4Press platform.
Data correspond to usage on the plateform after 2015. The current usage metrics is available 48-96 hours after online publication and is updated daily on week days.
Initial download of the metrics may take a while.