Fig. 3
Download original image
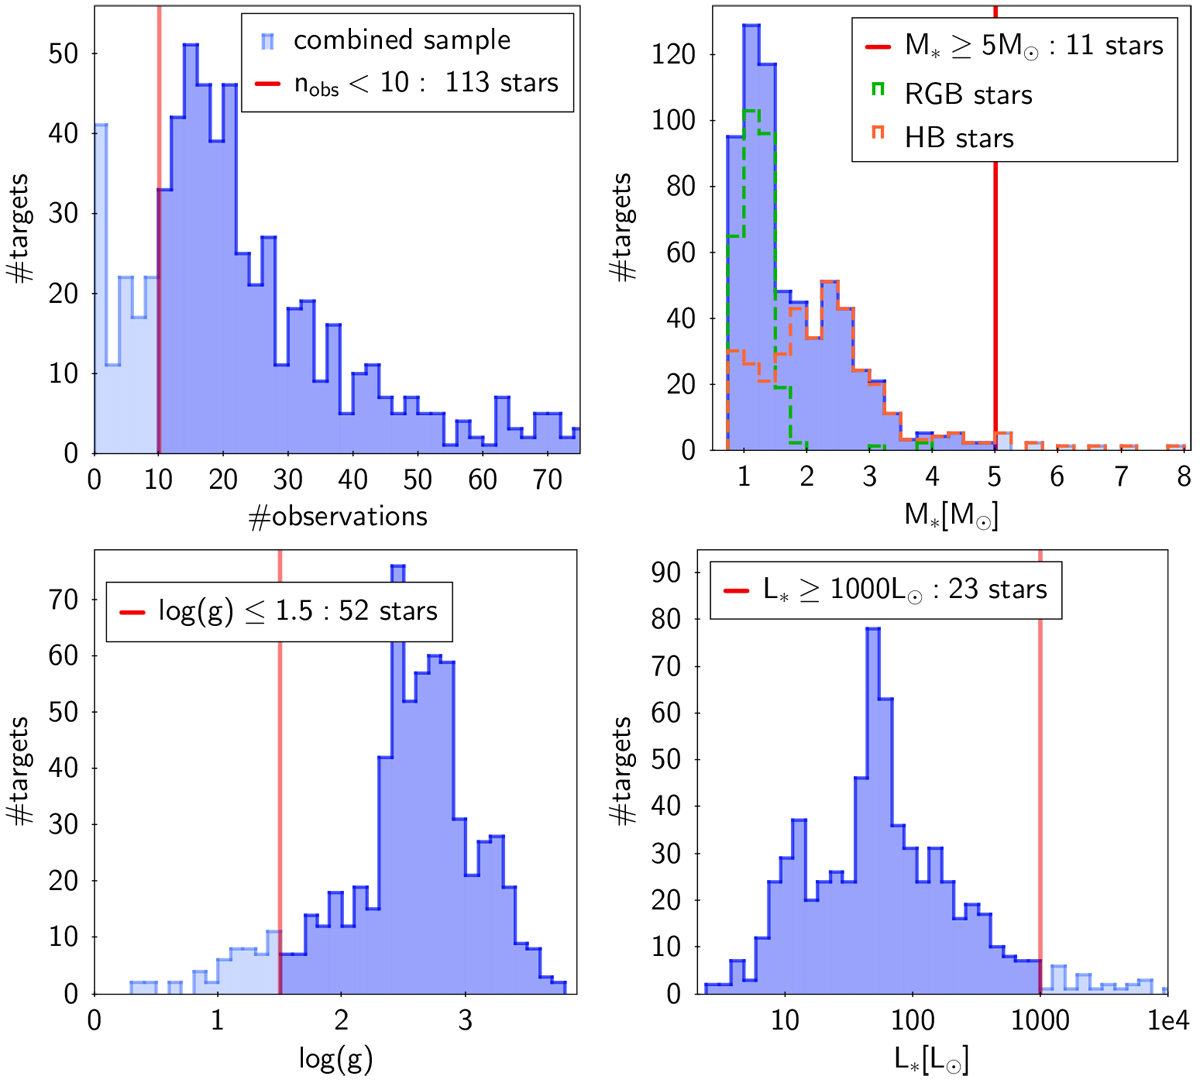
Histograms to illustrate the homogenizing cuts applied to the target stars. Top left: distribution of the number of radial velocity data points, stars with 10 observations or less are excluded (the plot is truncated toward larger numbers; more than 50 stars have more than 70 RV data points). Top right: distribution of the stellar mass; stars as massive as 5 M⊙ or more are excluded. The mass distributions of the stars more likely to be on the RGB and HB are shown in green and orange, respectively. Bottom left: distribution of stellar surface gravity; stars with log(ɡ) equal to or less than 1.5 are excluded. Bottom right: distribution of stellar luminosity; stars as luminous as 1000 L⊙ or more are excluded.
Current usage metrics show cumulative count of Article Views (full-text article views including HTML views, PDF and ePub downloads, according to the available data) and Abstracts Views on Vision4Press platform.
Data correspond to usage on the plateform after 2015. The current usage metrics is available 48-96 hours after online publication and is updated daily on week days.
Initial download of the metrics may take a while.