Fig. 12
Download original image
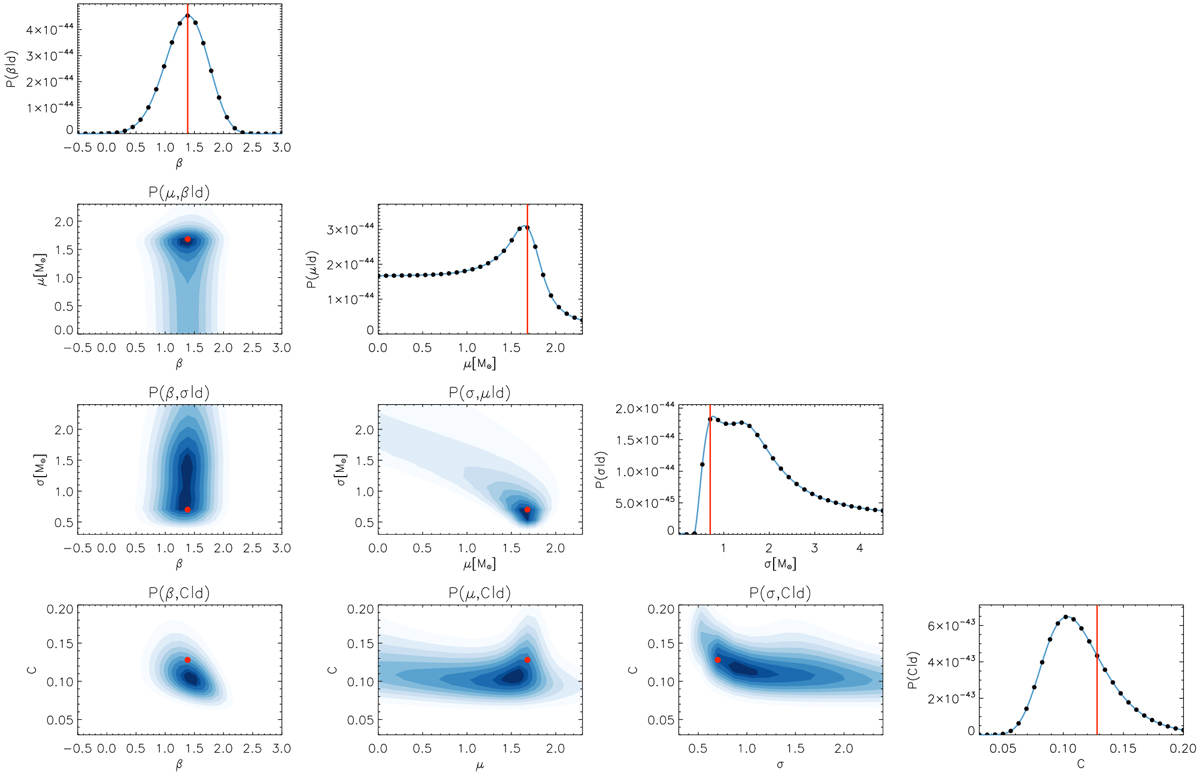
Marginal probability distributions functions (PDFs) from the maximum likelihood estimation for the set of model parameters from Eq. (6). The rightmost plot in each row shows the PDF of the indicated model parameter marginalized over the remaining three. The black dots show the grid values used for evaluating the likelihood, the blue line is a spline interpolation between them. The remaining plots show the different two-dimensional PDFs marginalized overtwo parameters with blue contours indicating levels from 95% down to 10% of the maximumprobability. The red dots and vertical red lines identify the parameter values corresponding to the maximum overall likelihood. Axes are limited to the chosen uniform prior ranges.
Current usage metrics show cumulative count of Article Views (full-text article views including HTML views, PDF and ePub downloads, according to the available data) and Abstracts Views on Vision4Press platform.
Data correspond to usage on the plateform after 2015. The current usage metrics is available 48-96 hours after online publication and is updated daily on week days.
Initial download of the metrics may take a while.