Fig. 11
Download original image
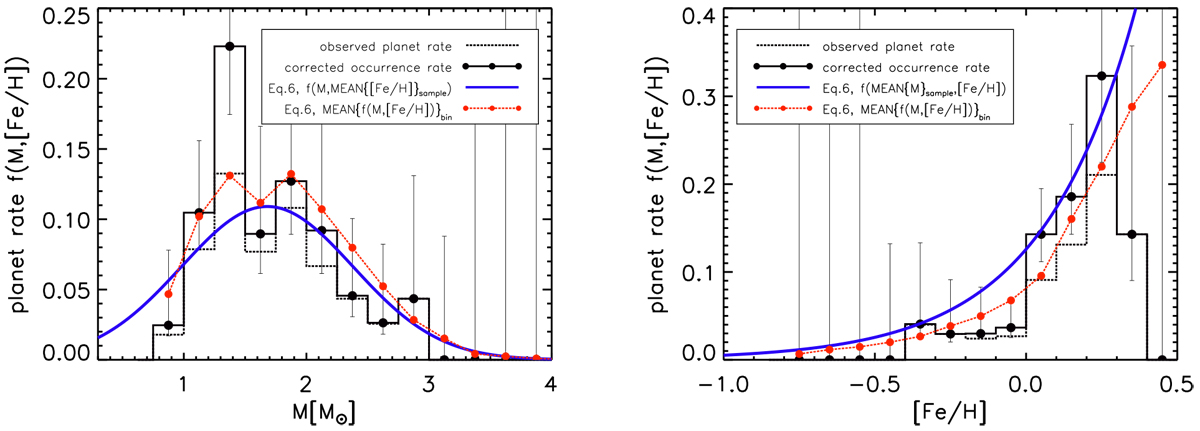
Planet occurrence rate as a function of stellar mass (left) and metallicity (right). The black dotted histograms show the distribution of planets, while the solid black histograms show an estimate of the completeness correction performed for the individual bins according to the procedure outlined in Sect. 6. The blue solid line represents the fitted occurrence as a function of stellar mass (left) with the metallicity set to the sample mean of [Fe/H] = -0.05 and as a function of metallicity (right) with the mass set to the sample mean of M, = 1.81 M⊙. For a more precise prediction, the red dots give the average expected occurrence rate computed using the masses and metallicities of the stars in each bin. Note that we fit the dependence on stellar mass and metallicity simultaneously and that we show the histograms only for visualization, the fit does not rely on binning of the data.
Current usage metrics show cumulative count of Article Views (full-text article views including HTML views, PDF and ePub downloads, according to the available data) and Abstracts Views on Vision4Press platform.
Data correspond to usage on the plateform after 2015. The current usage metrics is available 48-96 hours after online publication and is updated daily on week days.
Initial download of the metrics may take a while.