Free Access
Fig. 10
Download original image
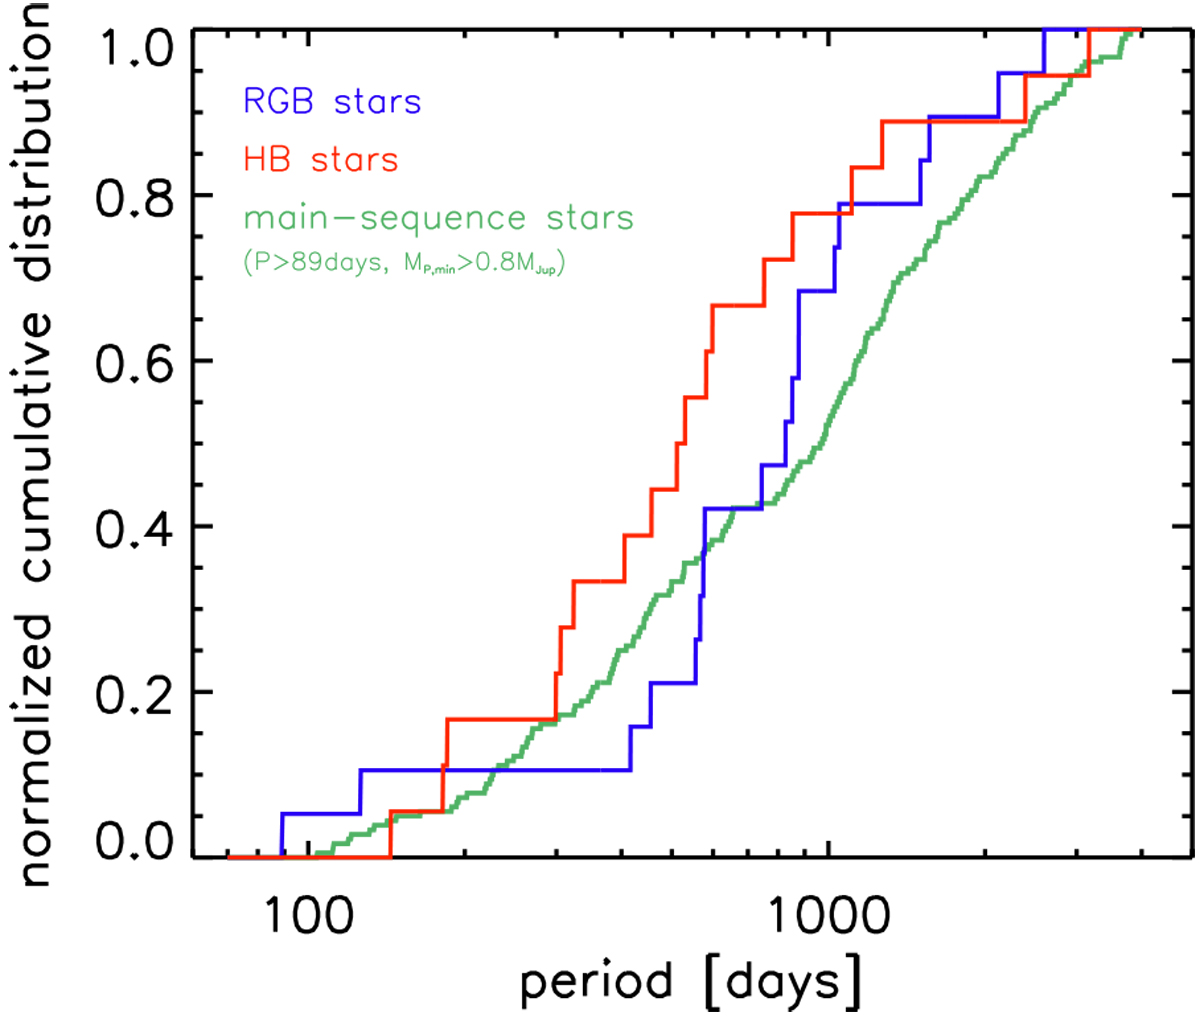
Same as Fig. 9 but the host stars were divided into two subsets based on their evolutionary stage. The blue line shows the period distribution of planets orbiting RGB stars, while the red line corresponds to planets hosted by HB stars. The green line again traces the giant planets around main-sequence stars.
Current usage metrics show cumulative count of Article Views (full-text article views including HTML views, PDF and ePub downloads, according to the available data) and Abstracts Views on Vision4Press platform.
Data correspond to usage on the plateform after 2015. The current usage metrics is available 48-96 hours after online publication and is updated daily on week days.
Initial download of the metrics may take a while.