Fig. 7
Download original image
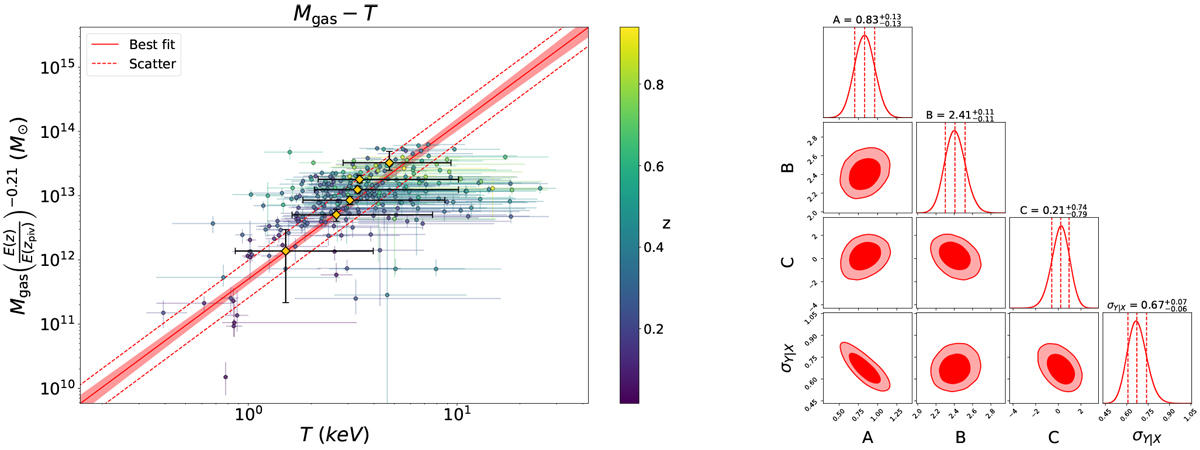
Mgas − T scaling relation and the posterior distributions of the scaling relation parameters. Left: gas mass (Mgas), temperature (T), and redshift (z) measurements of the ℒdet > 15, ℒext > 15 sample and the best-fit scaling relation models. The light-red shaded area indicates the 1σ uncertainty of the mean of the log-normal model (see Eq. (5)) and the dashed red line indicates the best-fit standard deviation ![]() around the mean. Orange diamonds indicate median temperature measurements obtained from clusters between gas mass quantiles. Right: parameter constraints of the Mgas − T relation obtained from the second half of the MCMC chains. Marginalized posterior distributions are shown on the diagonal plots and the joint posterior distributions are shown on off-diagonal plots. Red dashed vertical lines indicate 32th, 50th, and 68th percentiles and contours indicate 68 and 95% credibility regions.
around the mean. Orange diamonds indicate median temperature measurements obtained from clusters between gas mass quantiles. Right: parameter constraints of the Mgas − T relation obtained from the second half of the MCMC chains. Marginalized posterior distributions are shown on the diagonal plots and the joint posterior distributions are shown on off-diagonal plots. Red dashed vertical lines indicate 32th, 50th, and 68th percentiles and contours indicate 68 and 95% credibility regions.
Current usage metrics show cumulative count of Article Views (full-text article views including HTML views, PDF and ePub downloads, according to the available data) and Abstracts Views on Vision4Press platform.
Data correspond to usage on the plateform after 2015. The current usage metrics is available 48-96 hours after online publication and is updated daily on week days.
Initial download of the metrics may take a while.