Fig. 1
Download original image
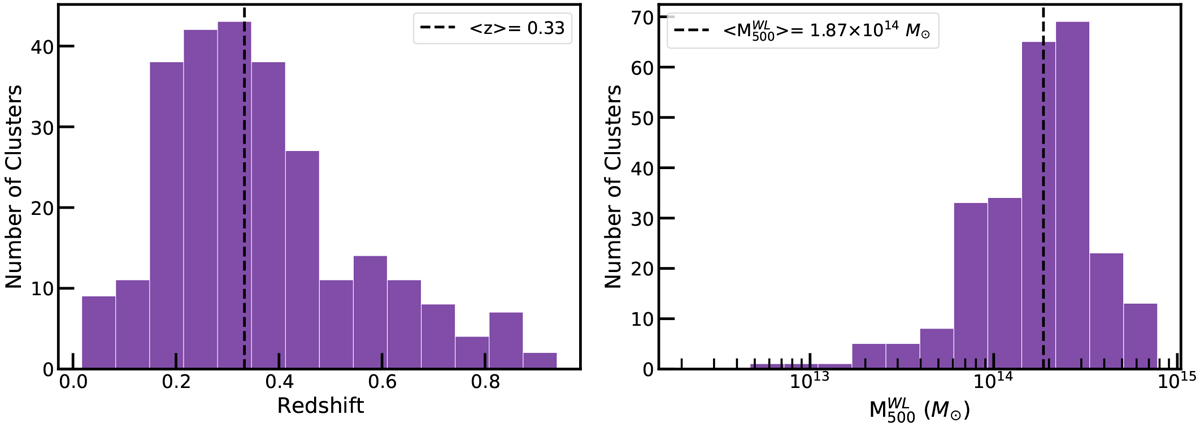
Left: redshift histogram of the ℒdet > 15, ℒext > 15 sample used in this work. Right: weak lensing calibrated total mass ![]() histogram of the ℒdet > 15, ℒext > 15 sample used in this work excluding upper limit measurements. Medians of the measurements are marked with dashed line. The overdensity radii of R500 within which we measure the X-ray observables are calculated from these mass measurements (see Chiu et al. 2022).
histogram of the ℒdet > 15, ℒext > 15 sample used in this work excluding upper limit measurements. Medians of the measurements are marked with dashed line. The overdensity radii of R500 within which we measure the X-ray observables are calculated from these mass measurements (see Chiu et al. 2022).
Current usage metrics show cumulative count of Article Views (full-text article views including HTML views, PDF and ePub downloads, according to the available data) and Abstracts Views on Vision4Press platform.
Data correspond to usage on the plateform after 2015. The current usage metrics is available 48-96 hours after online publication and is updated daily on week days.
Initial download of the metrics may take a while.