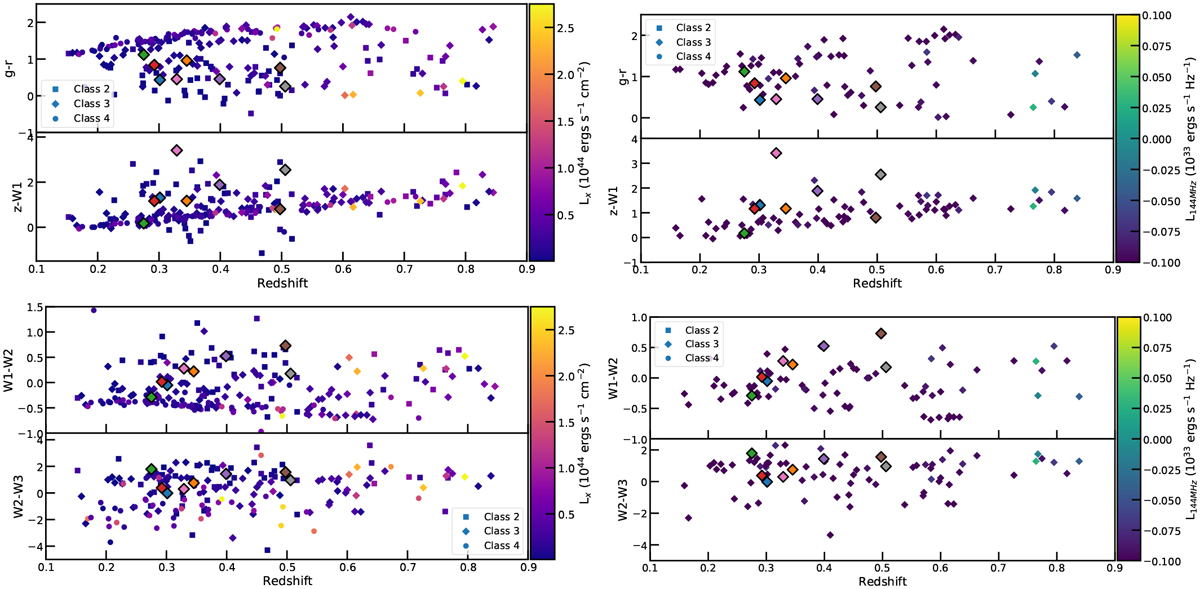
Fig. 9
Download original image
Color redshift diagrams of the Class 2, 3, and 4 clusters, g-r, z-W1, W2-W3, and W1-W2 color diagrams of the counterparts identified by NWAY as a function of X-ray (panels on the left) and radio (panels on the right) luminosities of the host clusters in Classes 2, 3, and 4 with secure NWAY and MCMF counterparts. The outlier clusters are shown in black. They include the Class 3 clusters and groups with radio loud-AGN in their BCGs selected based on our color criteria. All these four cases have SDSS spectroscopy for further investigation.
Current usage metrics show cumulative count of Article Views (full-text article views including HTML views, PDF and ePub downloads, according to the available data) and Abstracts Views on Vision4Press platform.
Data correspond to usage on the plateform after 2015. The current usage metrics is available 48-96 hours after online publication and is updated daily on week days.
Initial download of the metrics may take a while.