Fig. 7
Download original image
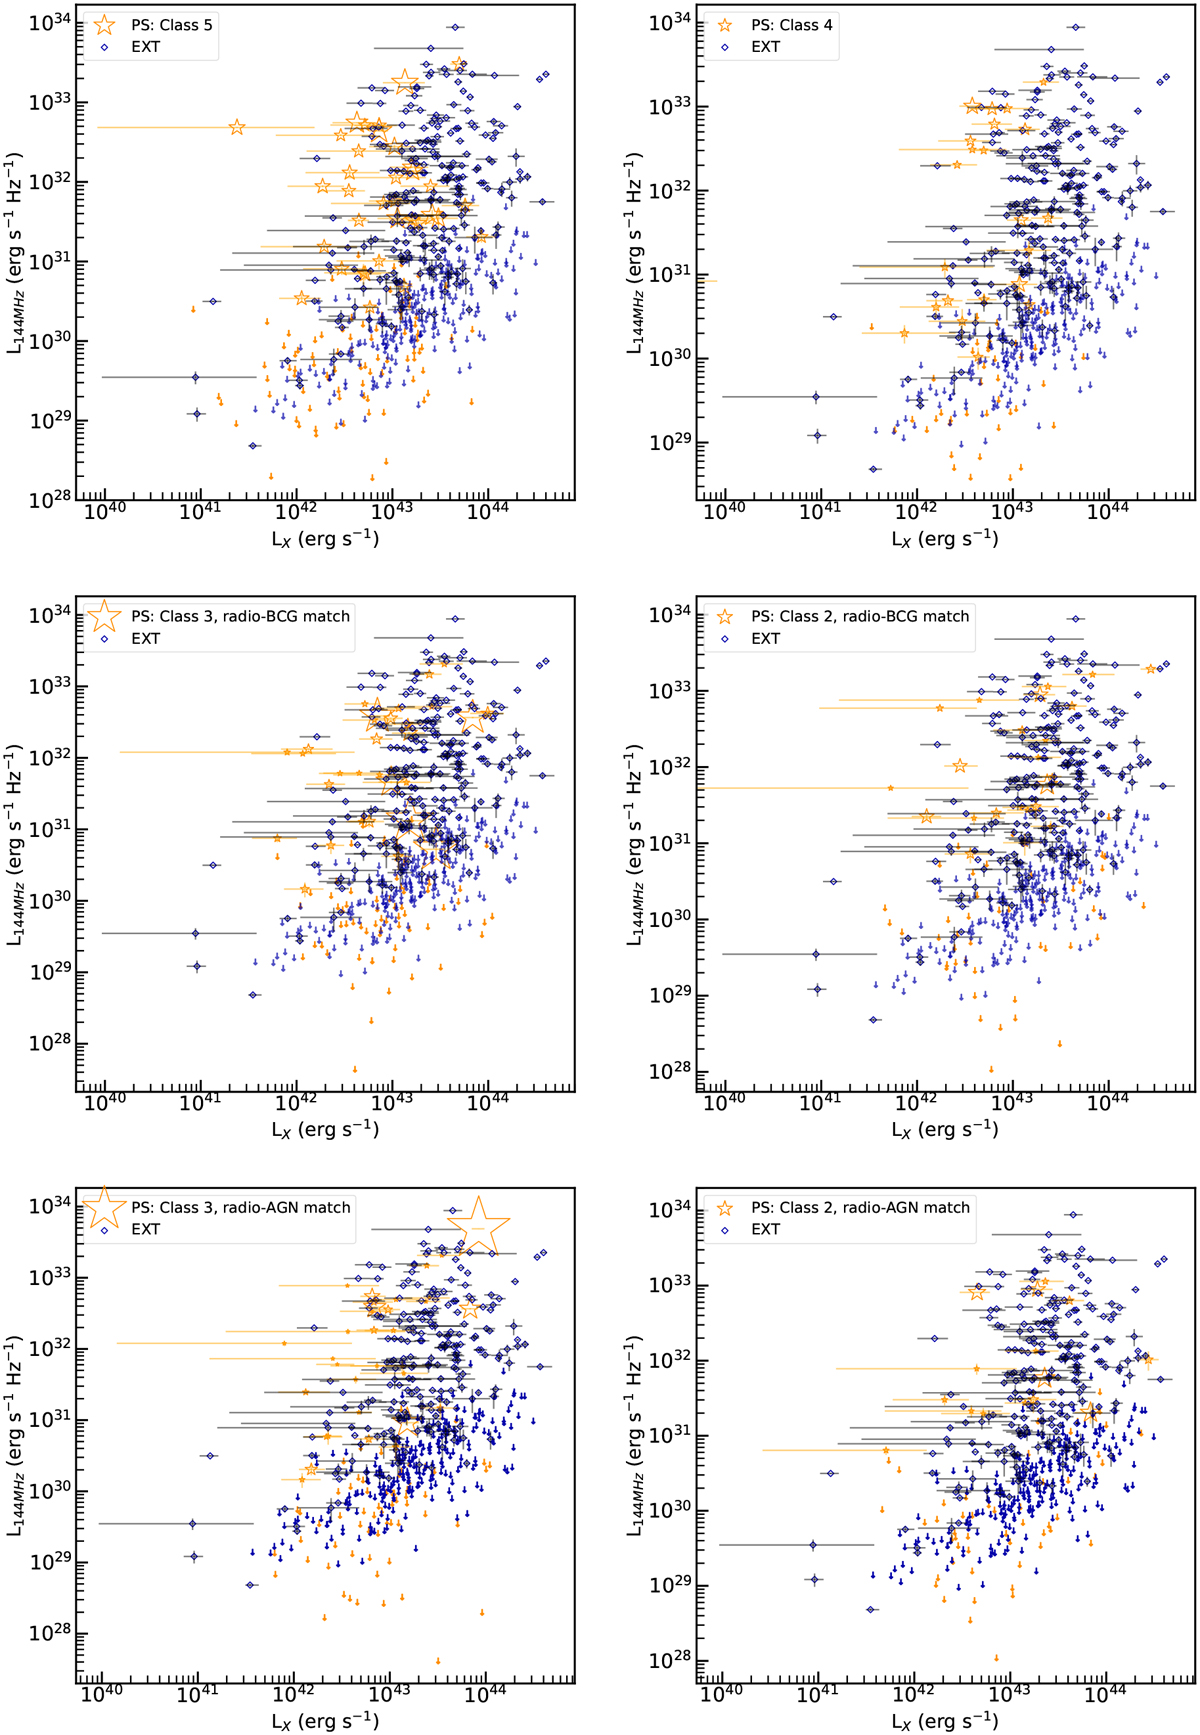
Radio properties of the clusters in the point source sample compared with the extent selected sample. Top and middle panels: radio power of BCGs versus X-ray luminosity of the host cluster for the PS sample (orange) and for the cluster sample studied in P21 (blue). Data are sized based on the detection likelihood, and arrows denote radio upper limits. From top left to bottom right: clusters of class 5, 4, 3 and 2. Bottom panel: radio power measured at the position of the AGN vs. X-ray luminosity for Class 3 (left) and 2 (right) objects.
Current usage metrics show cumulative count of Article Views (full-text article views including HTML views, PDF and ePub downloads, according to the available data) and Abstracts Views on Vision4Press platform.
Data correspond to usage on the plateform after 2015. The current usage metrics is available 48-96 hours after online publication and is updated daily on week days.
Initial download of the metrics may take a while.