Fig. 5
Download original image
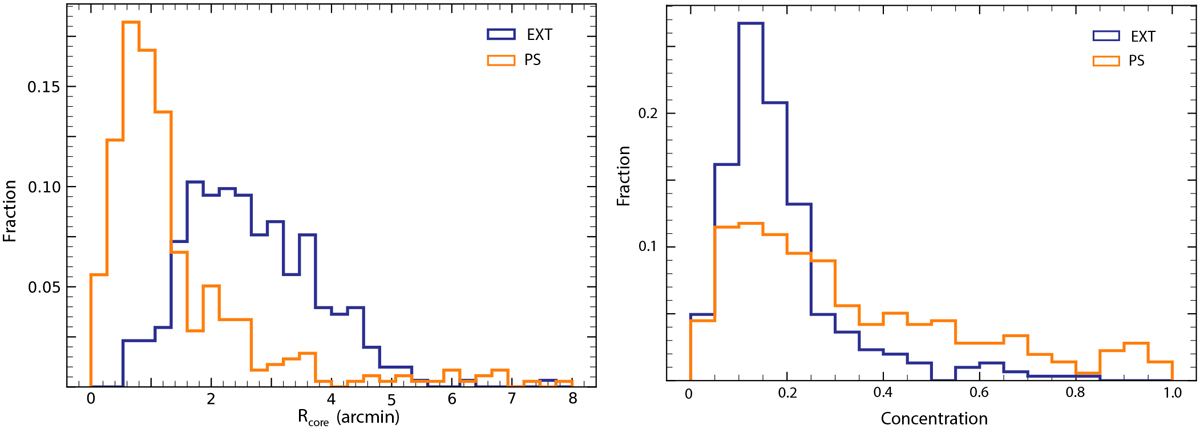
Distributions of the Rcore and cSB as a measure of compactness of the clusters in the point source catalog and the extent selected catalogs. The left panel shows the distribution of Rcore of the cluster sample in the point source catalog (orange) and the extent-selected (Lext > 12) cluster sample (blue). The right panel shows that the distribution of the cSB of the clusters in the point source catalog is smaller than in the extent-selected sample, indicating that the clusters in the point source catalog are more compact.
Current usage metrics show cumulative count of Article Views (full-text article views including HTML views, PDF and ePub downloads, according to the available data) and Abstracts Views on Vision4Press platform.
Data correspond to usage on the plateform after 2015. The current usage metrics is available 48-96 hours after online publication and is updated daily on week days.
Initial download of the metrics may take a while.