Fig. 3
Download original image
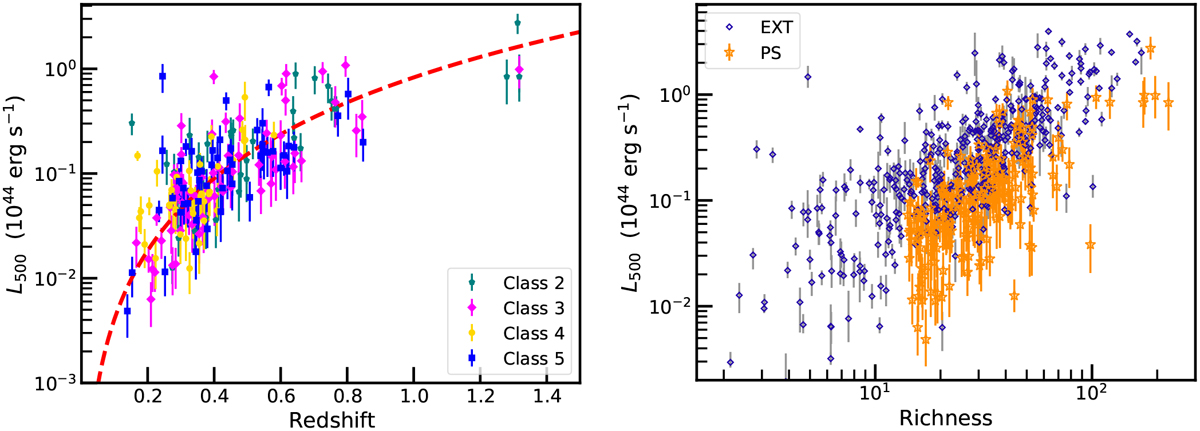
Luminosity distribution of clusters with respect to redshift, class, and richness. Left panel: luminosity-redshift distribution of the clusters and groups identified in the point source sample based on their class. A 2σ detection limit is applied on the luminosities. The flux limit for the extent-selected sample of 1.5 × 10⁻¹⁴ ergs s−1 cm−2 is displayed as the dashed red line (Liu et al. 2022a). The luminosity of most clusters in the point source catalog is lower than that of the extent-selected sample, indicating that this sample is composed of clusters and groups that are smaller in extent and lower in mass, whose emission might be dominated by the central AGN. Right panel: X-ray luminosity as a function of the red-sequence richness. The blue data points show the extent-selected sample (Liu et al. 2022a; Klein et al. 2021). The orange points mark the clusters in the point source sample.
Current usage metrics show cumulative count of Article Views (full-text article views including HTML views, PDF and ePub downloads, according to the available data) and Abstracts Views on Vision4Press platform.
Data correspond to usage on the plateform after 2015. The current usage metrics is available 48-96 hours after online publication and is updated daily on week days.
Initial download of the metrics may take a while.