Fig. 13
Download original image
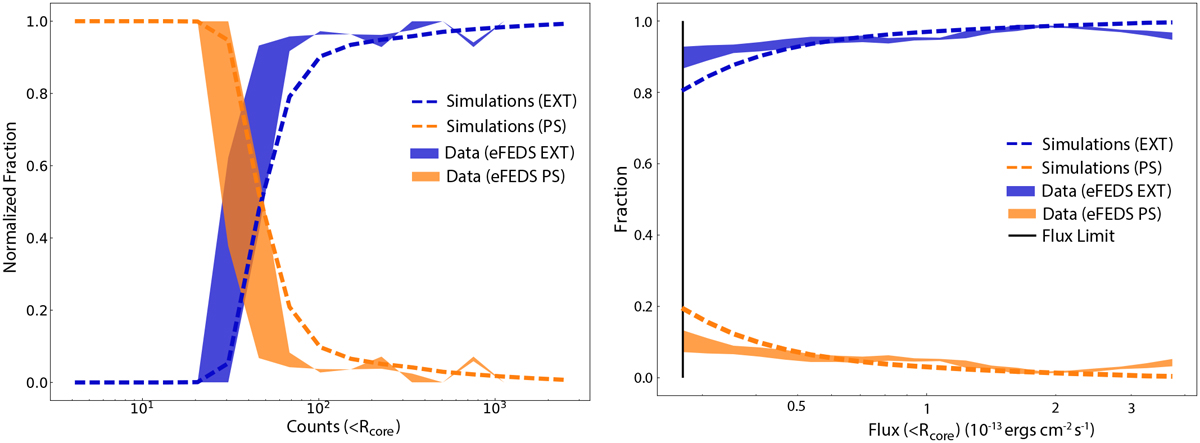
Comparisons of the number of clusters in point source and extent selected catalogs with eROSITA simulations. Left panel: the fraction of clusters detected in the extent-selected sample vs. the clusters in the point source sample as a function of the counts in Rcore (specified as a ML_CTS in the ermldet detection runs) in simulations. Right panel: the cumulative number of clusters in the extended and point source catalogs above a detection flux (ML_Flux in the ermldet runs) limit of 2.7 × 10⁻¹⁴ ergs s−1 cm−2 measured within Rcore (EXT parameter in ermldet outputs).
Current usage metrics show cumulative count of Article Views (full-text article views including HTML views, PDF and ePub downloads, according to the available data) and Abstracts Views on Vision4Press platform.
Data correspond to usage on the plateform after 2015. The current usage metrics is available 48-96 hours after online publication and is updated daily on week days.
Initial download of the metrics may take a while.