Fig. 12
Download original image
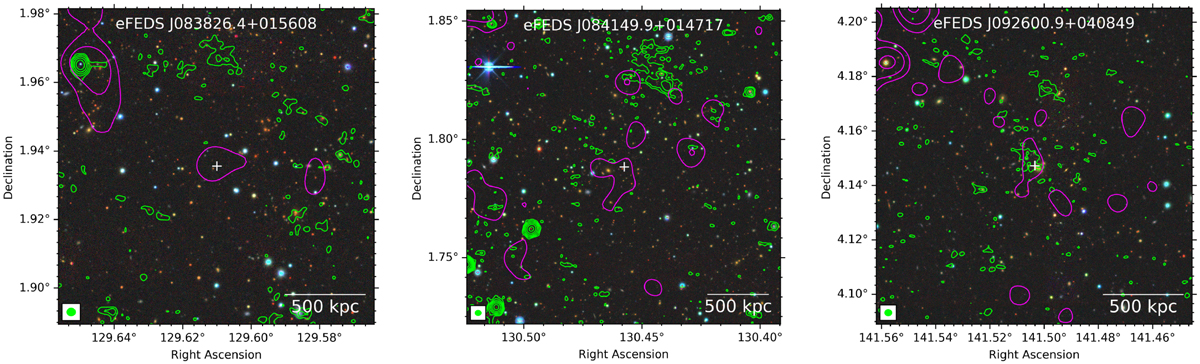
Clusters that host diffuse emission in the ICM. The background are DECaLS optical band-grz images. The LOFAR (green) and eROSITA (magenta) first contours are drawn at 3σ. The subsequent contours are multiplied by a factor of 2. The cross at the center of the images indicates the location of the clusters.
Current usage metrics show cumulative count of Article Views (full-text article views including HTML views, PDF and ePub downloads, according to the available data) and Abstracts Views on Vision4Press platform.
Data correspond to usage on the plateform after 2015. The current usage metrics is available 48-96 hours after online publication and is updated daily on week days.
Initial download of the metrics may take a while.