Fig. 10
Download original image
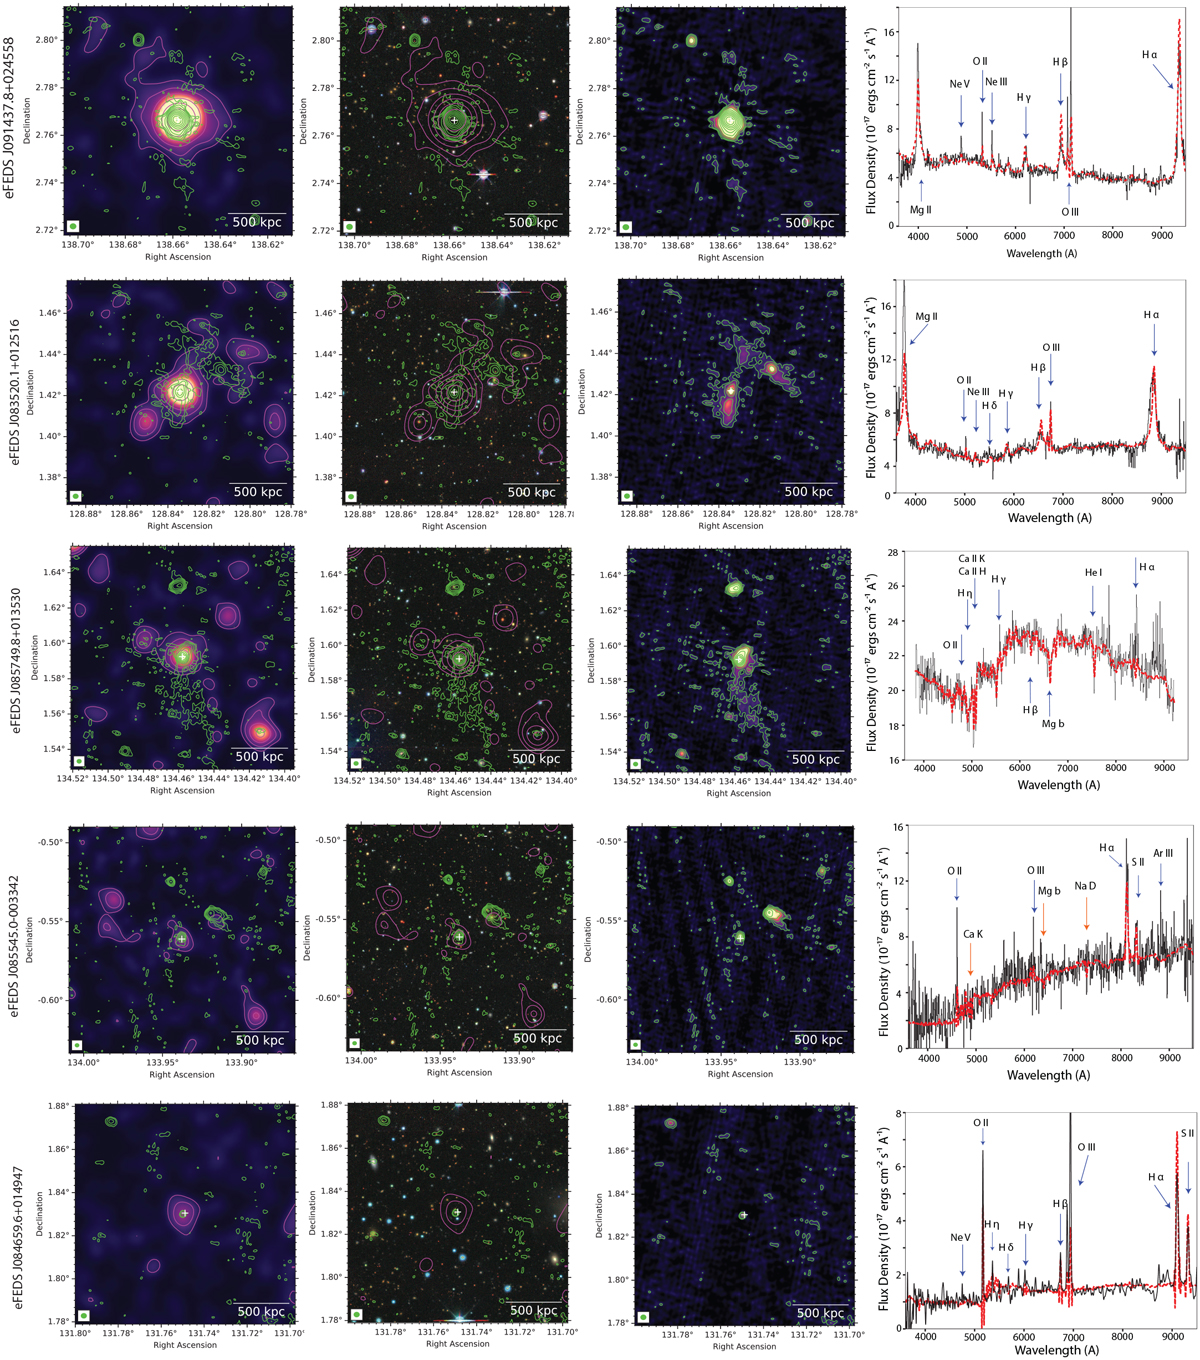
0.5–2 keV soft-band images of the AGN-hosting clusters and groups in Class 3. The soft-band eROSITA images are shown in the leftmost panel. In the two middle panels, we provide DECaLS images in the optical band and LOFAR images in the radio band of the same clusters. The red- sequence galaxies are shown in the DECALS images. The overlaid LOFAR contours in green show the location of the radio source associated with the identified BCGs from NWAY. Rightmost panels: SDSS spectra of the counterpart identified by the NWAY. Green lines show the significantly detected emission lines, whereas orange lines show the absorption lines on the optical SDSS spectra displayed in the right panels. The continuous line in red shows the best-fit model to the spectra.
Current usage metrics show cumulative count of Article Views (full-text article views including HTML views, PDF and ePub downloads, according to the available data) and Abstracts Views on Vision4Press platform.
Data correspond to usage on the plateform after 2015. The current usage metrics is available 48-96 hours after online publication and is updated daily on week days.
Initial download of the metrics may take a while.