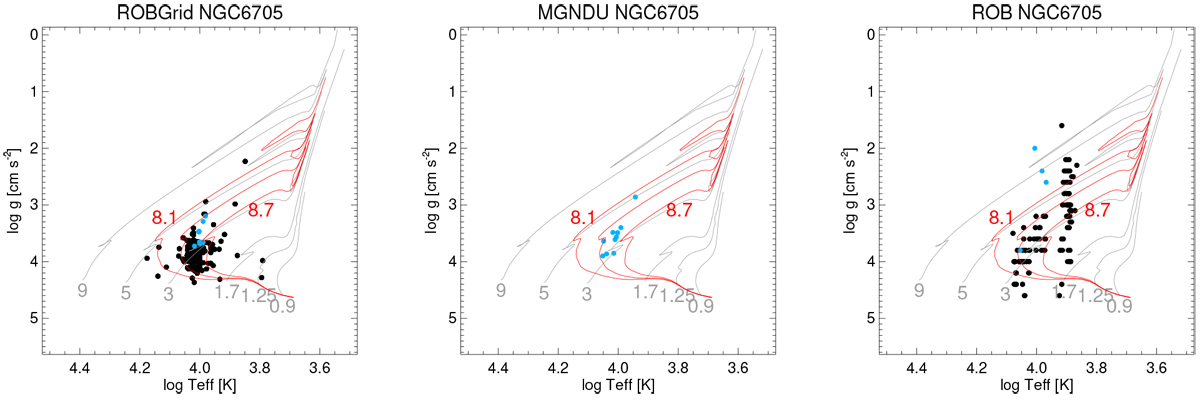
Fig. 9
Download original image
Kiel diagram for the cluster NGC 6705, with the results of three different Nodes (left panel: ROBGrid, middle panel: MGNDU, right panel: ROB). The black dots represent GIRAFFE results, blue dots UVES 520 results. The grey lines are evolutionary tracks labelled with their initial mass (in solar masses), and the red lines are isochrones labelled with log age (in years) = 8.1, 8.4, and 8.7. The tracks and isochrones are from Ekström et al. (2012).
Current usage metrics show cumulative count of Article Views (full-text article views including HTML views, PDF and ePub downloads, according to the available data) and Abstracts Views on Vision4Press platform.
Data correspond to usage on the plateform after 2015. The current usage metrics is available 48-96 hours after online publication and is updated daily on week days.
Initial download of the metrics may take a while.