Fig. 8
Download original image
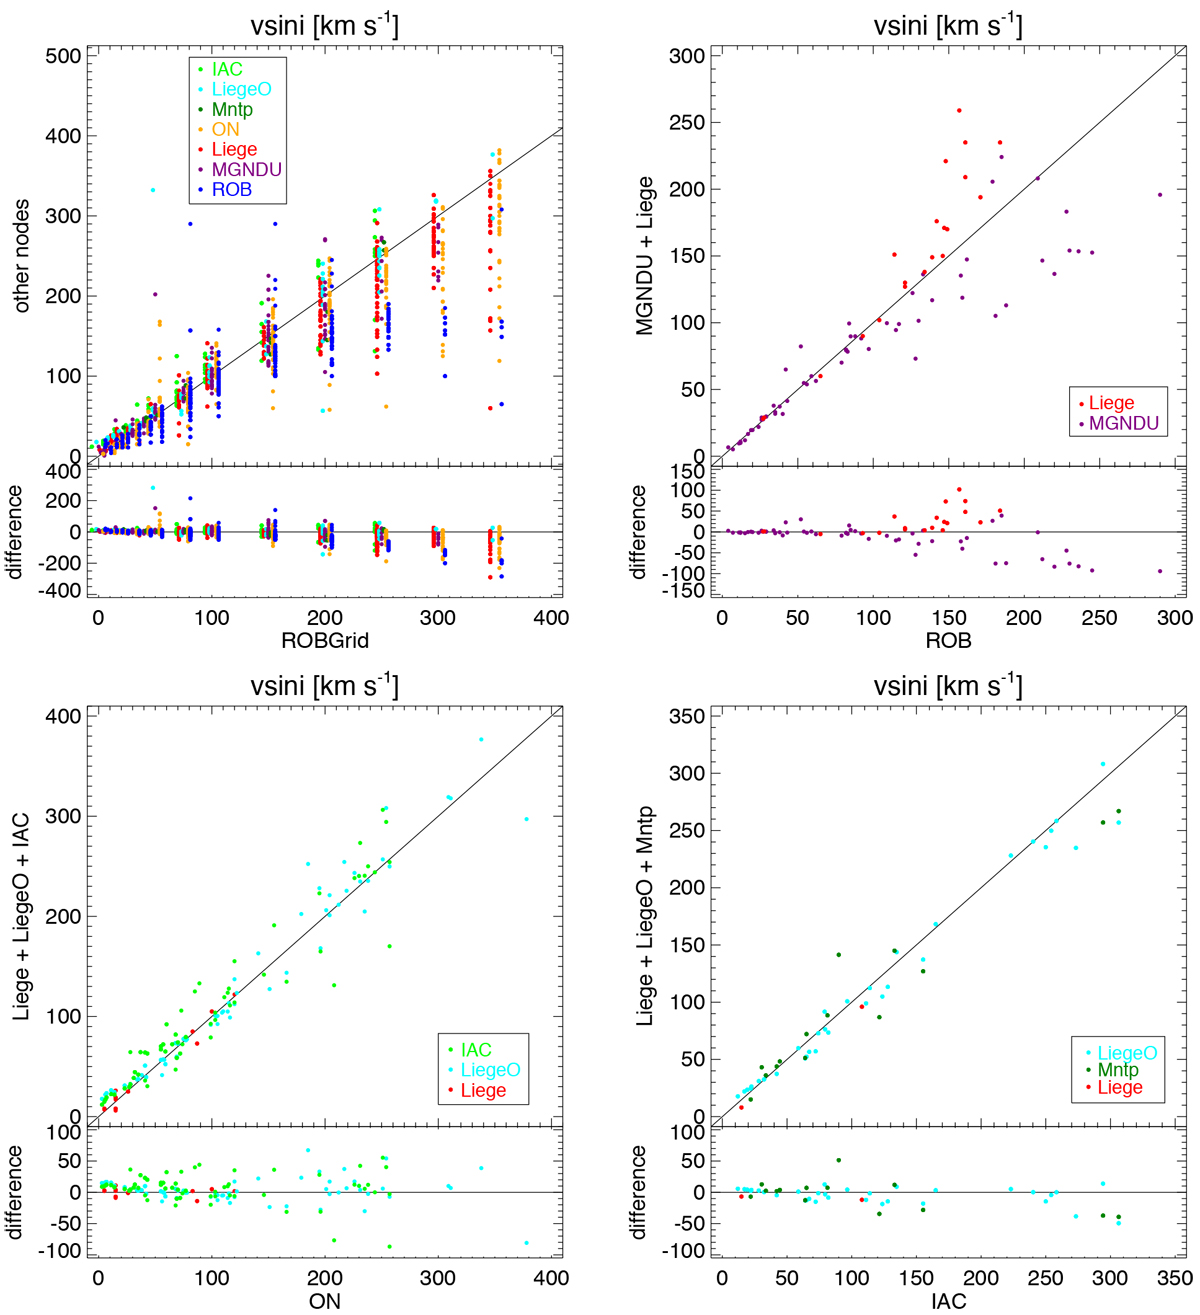
Comparison of the projected rotational velocity between different Nodes. Top left panel: compares ROBGrid to all other Nodes. To avoid too many overlapping points, the ROBGrid values have been slightly shifted from their true value. Top right panel: compares the ROB Node with the MGNDU and Liège results, which cover the cooler stars analysed by WG13. Bottom left panel: range of higher temperatures by comparing the ON Node with the Liège, LiègeO, and IAC results. Bottom right panel: compares IAC to Liège, LiègeO, and Mntp, which cover the range of highest temperatures. Typical 1σ uncertainties on the projected rotational velocity are 15%.
Current usage metrics show cumulative count of Article Views (full-text article views including HTML views, PDF and ePub downloads, according to the available data) and Abstracts Views on Vision4Press platform.
Data correspond to usage on the plateform after 2015. The current usage metrics is available 48-96 hours after online publication and is updated daily on week days.
Initial download of the metrics may take a while.