Free Access
Fig. 4
Download original image
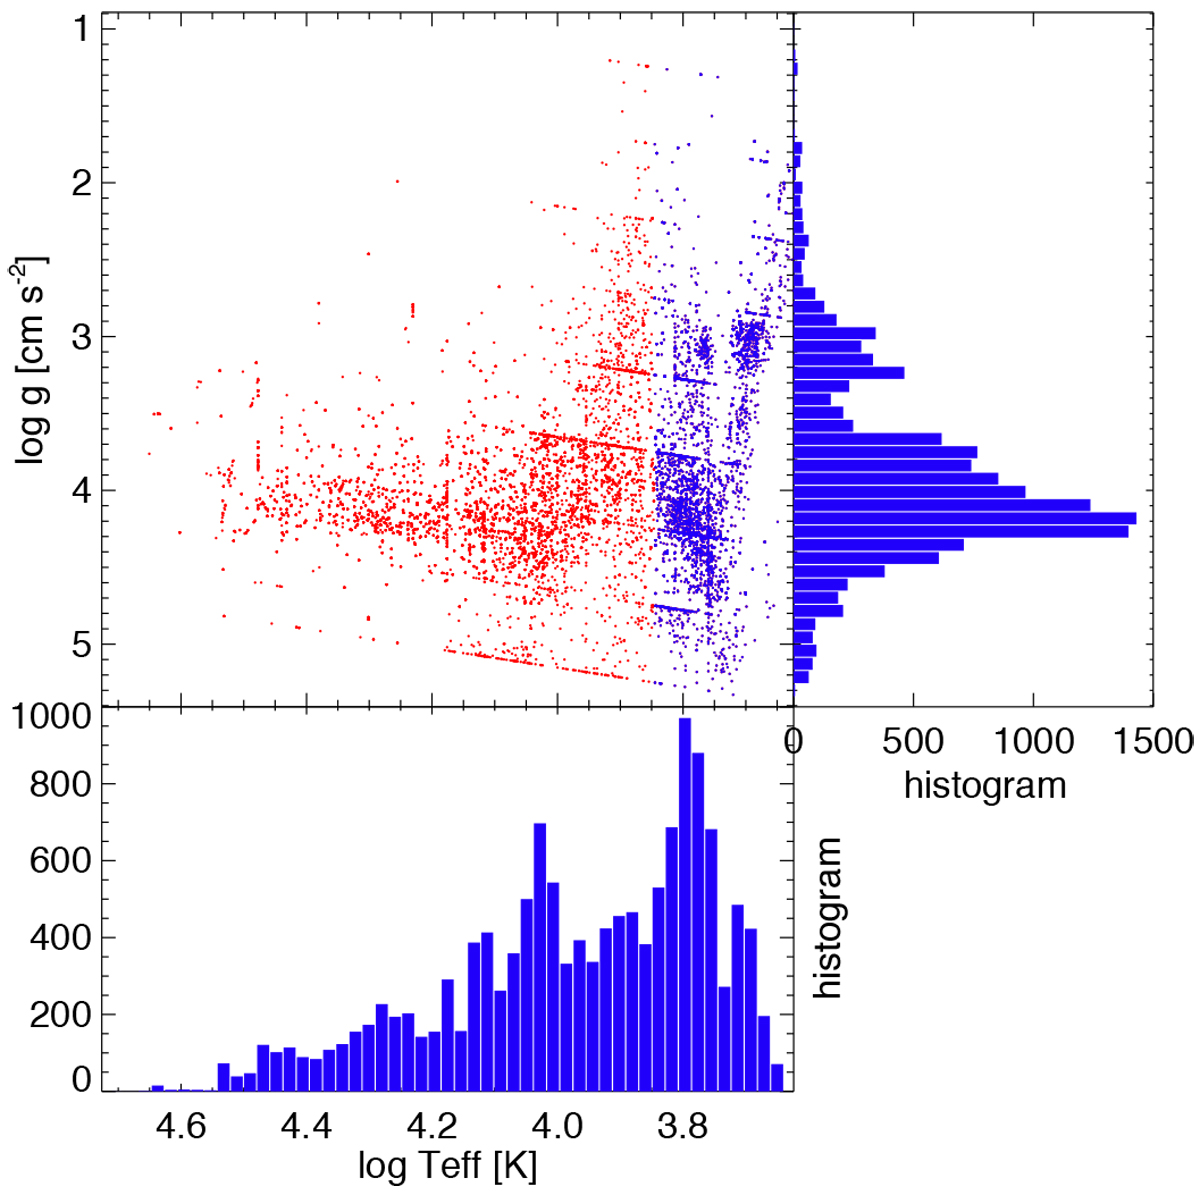
Kiel diagram of all ROBGrid results. Cool stars (Teff ≤ 7000 K) are indicated separately (in blue). Also plotted are the histograms of log Teff and log g; these histograms also include the cool stars.
Current usage metrics show cumulative count of Article Views (full-text article views including HTML views, PDF and ePub downloads, according to the available data) and Abstracts Views on Vision4Press platform.
Data correspond to usage on the plateform after 2015. The current usage metrics is available 48-96 hours after online publication and is updated daily on week days.
Initial download of the metrics may take a while.