Free Access
Fig. 12
Download original image
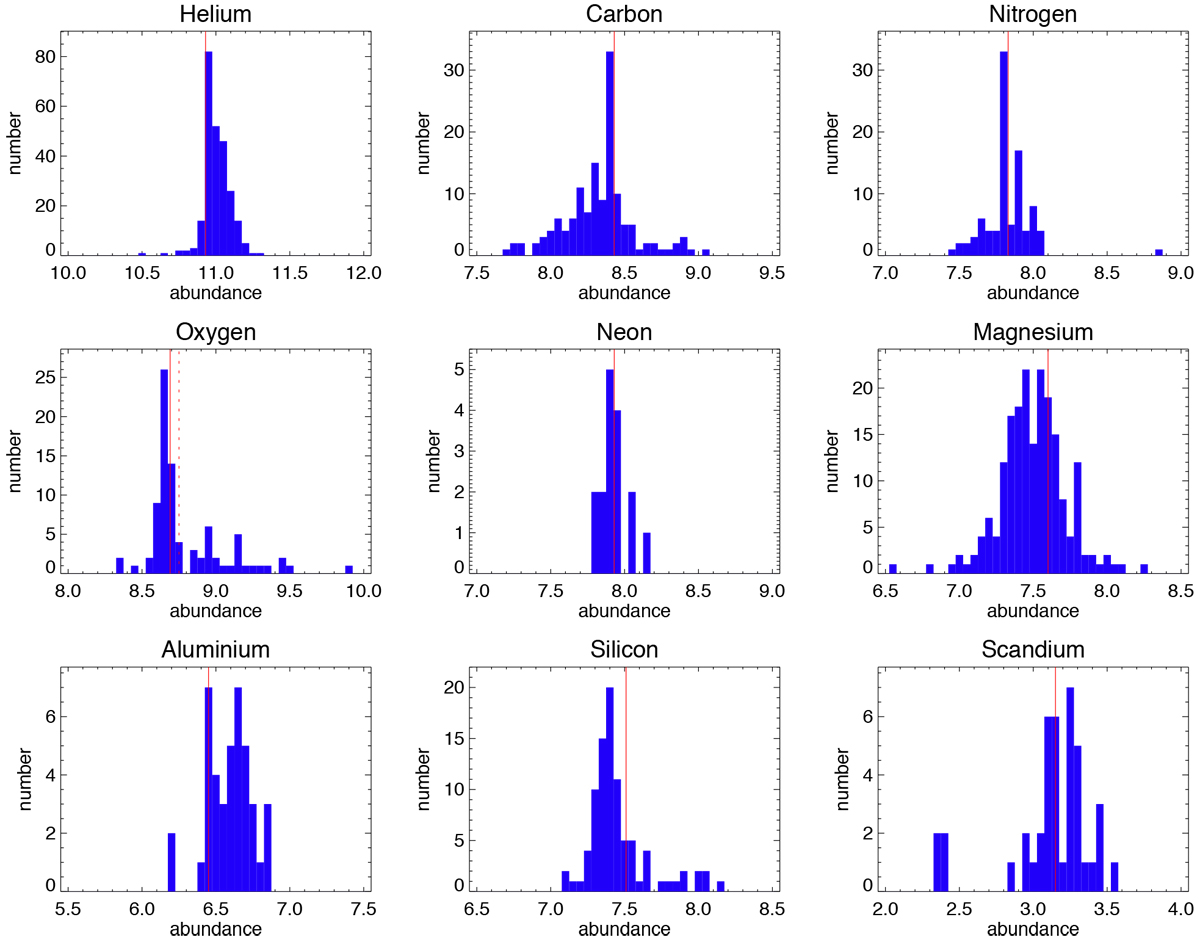
Histogram of the WG13 abundance determinations, expressed as log10(Nelement/NH) + 12. The solid red line indicates the solar abundance from Asplund et al. (2009); the dashed red line is the higher value for oxygen from Bergemann et al. (2021).
Current usage metrics show cumulative count of Article Views (full-text article views including HTML views, PDF and ePub downloads, according to the available data) and Abstracts Views on Vision4Press platform.
Data correspond to usage on the plateform after 2015. The current usage metrics is available 48-96 hours after online publication and is updated daily on week days.
Initial download of the metrics may take a while.