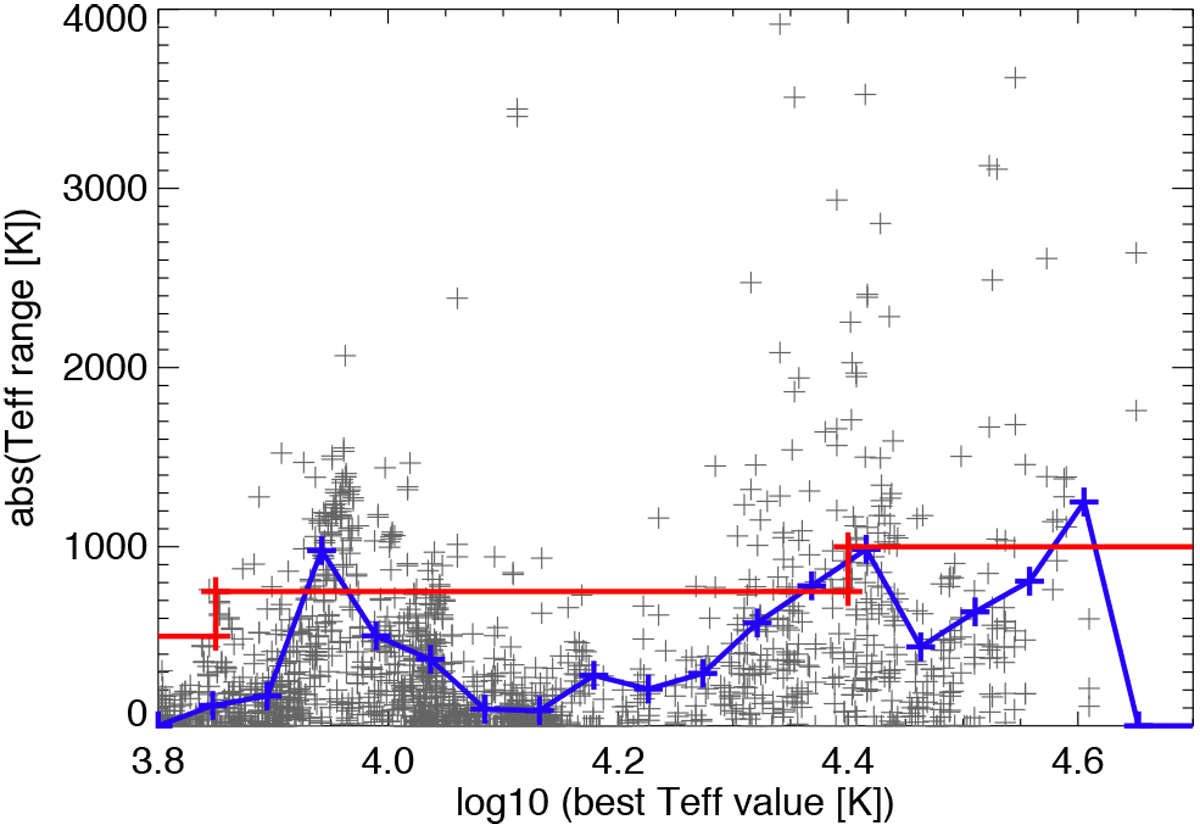
Fig. 10

Download original image
Uncertainty on the effective temperature as a function of effective temperature (Teff – log scale). The grey plus signs show the difference (absolute value) between the Node result and the recommended value. The blue line shows the range containing the inner 68.3% of the plus signs, within a Teff bin. The red line regularises this, taking into account that the uncertainty should increase with Teff; it is the 1σ uncertainty attributed to Teff in the recommended parameters.
Current usage metrics show cumulative count of Article Views (full-text article views including HTML views, PDF and ePub downloads, according to the available data) and Abstracts Views on Vision4Press platform.
Data correspond to usage on the plateform after 2015. The current usage metrics is available 48-96 hours after online publication and is updated daily on week days.
Initial download of the metrics may take a while.


