Fig. 9
Download original image
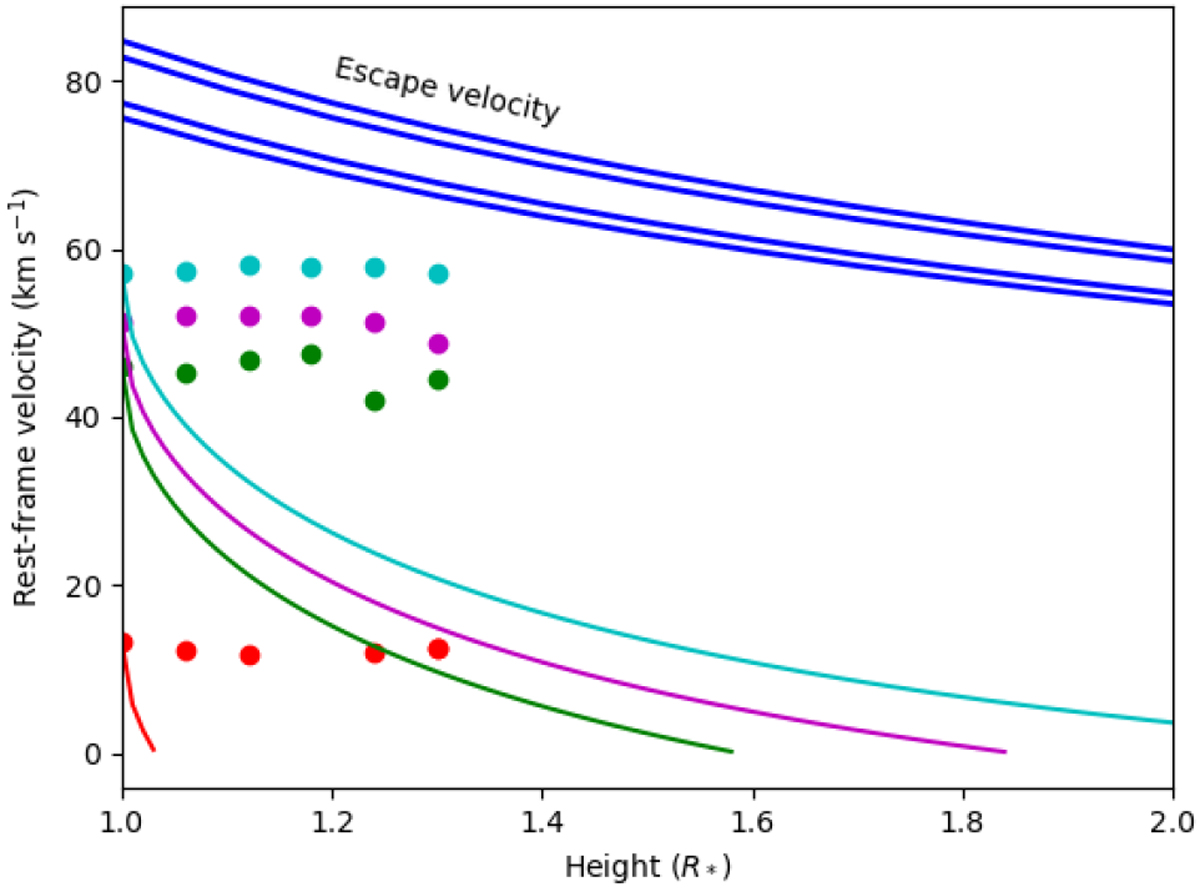
Plasma velocities as a function of height in four granules from Dec 12, 2013. The dots show measured velocities at the center of four granules, two of which are identified in Fig. 8. These are assumed to be vertical structures and the velocity is computed by re-interpreting changes in the distance to disk center in terms of velocity. For comparison, the thin colored lines show the expected velocities in a ballistic scenario. The four thick blue lines show the escape velocity as a function of height for the four cases of mass 15 or 18 M⊙ and radius 955 or 1000 R⊙.
Current usage metrics show cumulative count of Article Views (full-text article views including HTML views, PDF and ePub downloads, according to the available data) and Abstracts Views on Vision4Press platform.
Data correspond to usage on the plateform after 2015. The current usage metrics is available 48-96 hours after online publication and is updated daily on week days.
Initial download of the metrics may take a while.