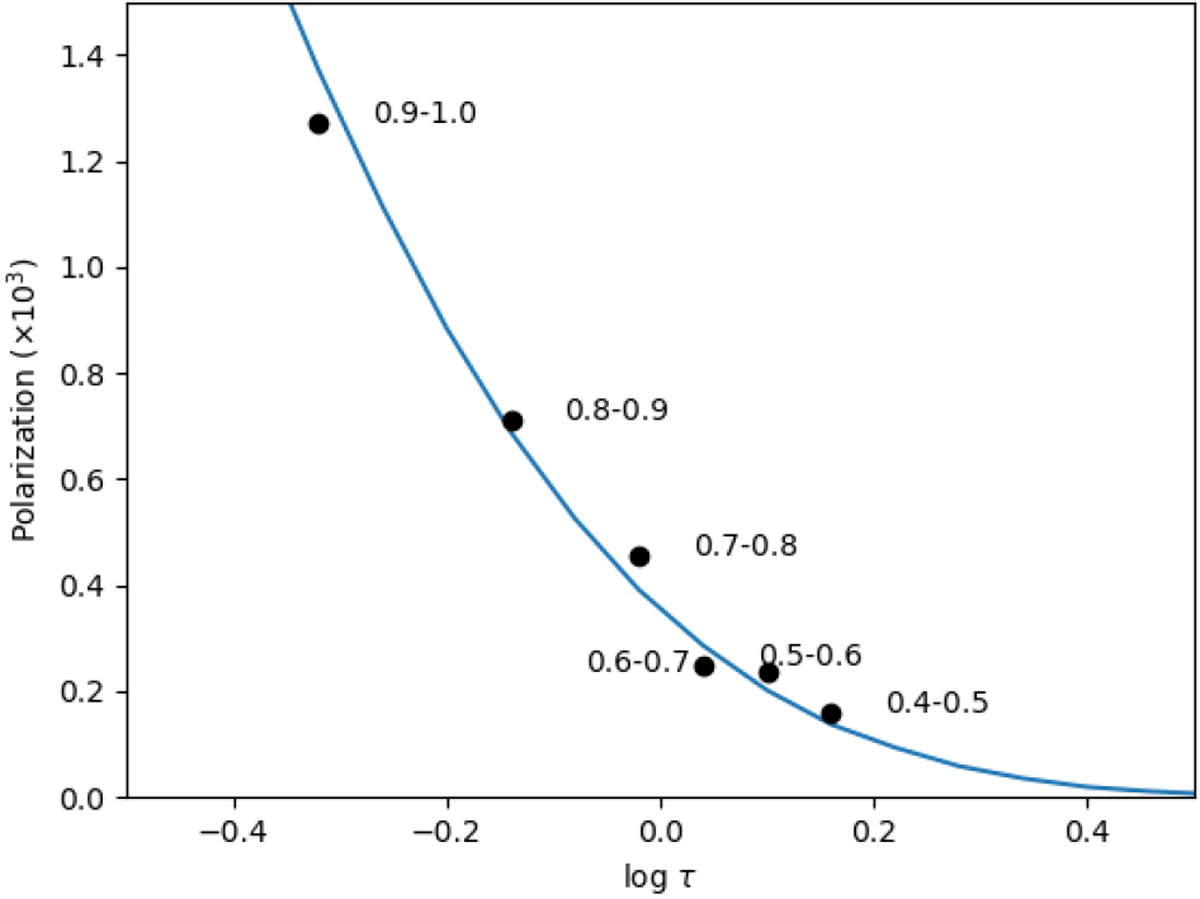
Fig. 5
Download original image
Observed linear polarization peak amplitudes (dots) for the six masks on the polarization spectra, both Q and U, of December 12, 2013. The abscissae of each dot is determined as the optical depth at which a gray atmosphere model fits the observed amplitude assuming a 1% rate of local polarization. The continuous line shows this model dependence.
Current usage metrics show cumulative count of Article Views (full-text article views including HTML views, PDF and ePub downloads, according to the available data) and Abstracts Views on Vision4Press platform.
Data correspond to usage on the plateform after 2015. The current usage metrics is available 48-96 hours after online publication and is updated daily on week days.
Initial download of the metrics may take a while.