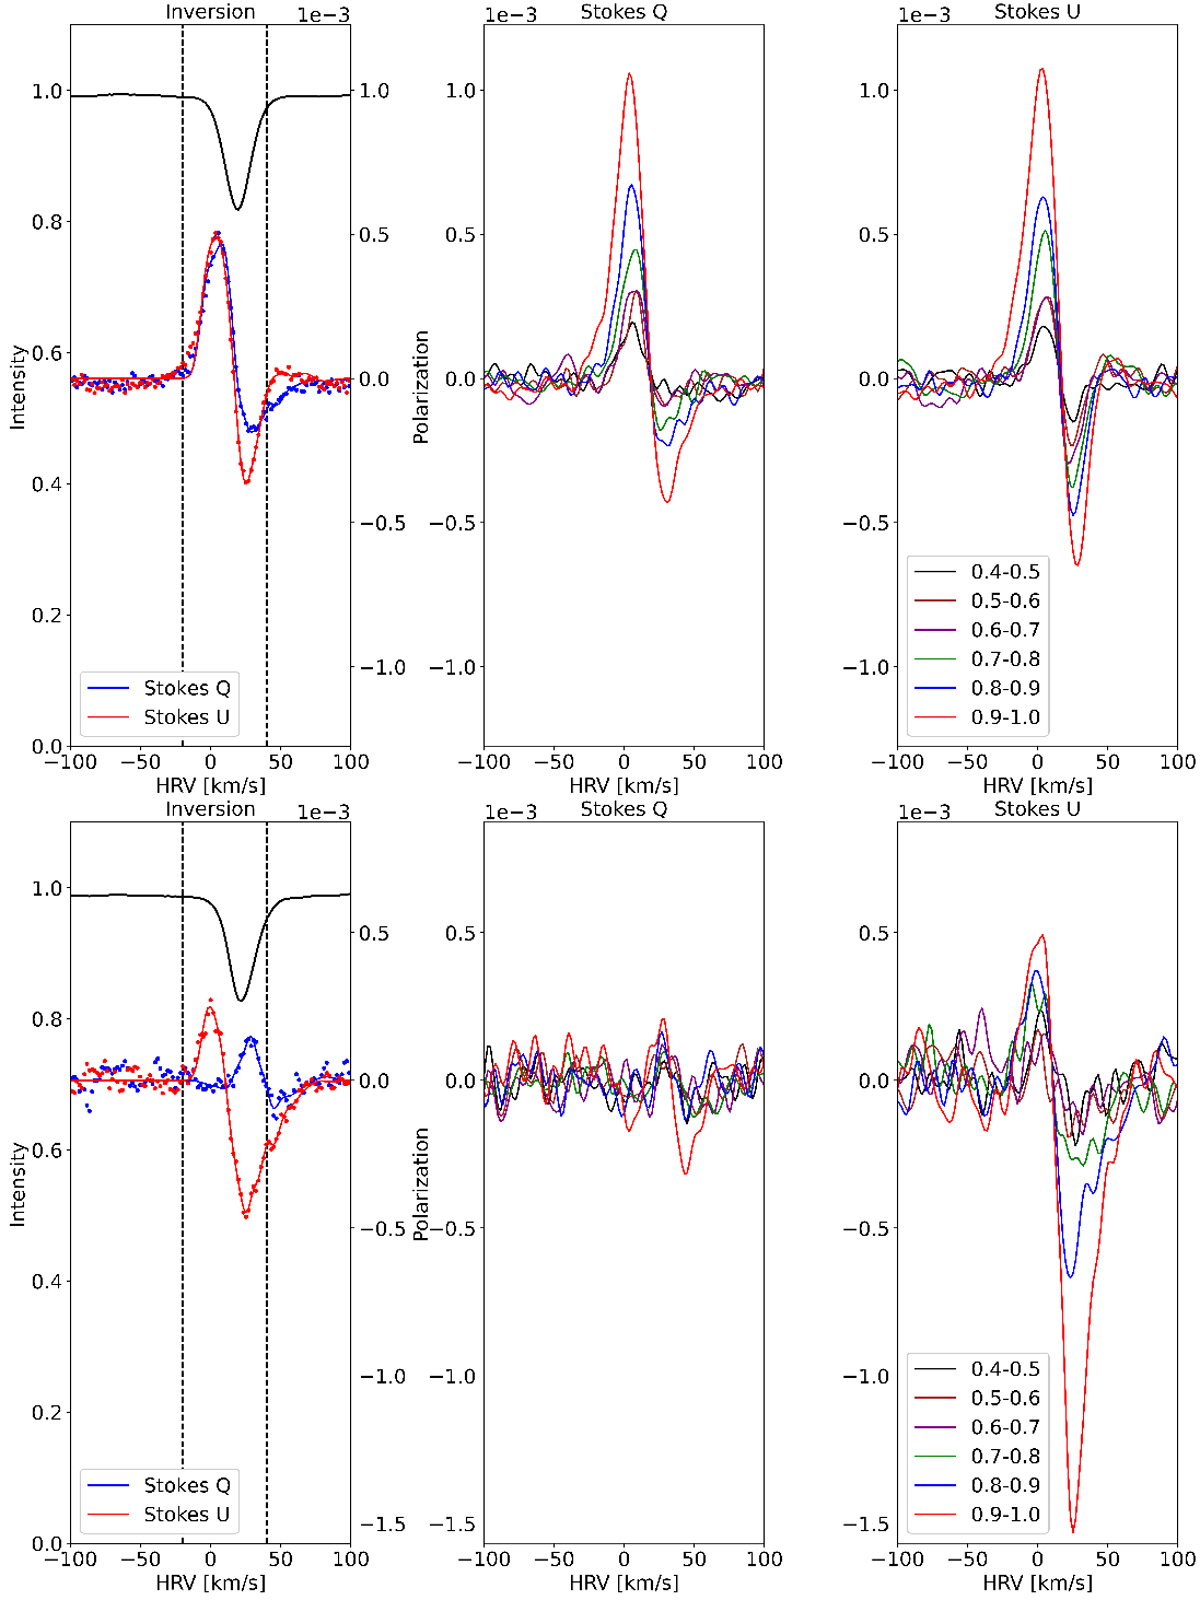
Fig. 4
Download original image
Stokes Q and U profiles for the two studied dates (December 12, 2013, above, and February 10, 2021, below). Stokes Q and U are defined in Narval and Neo-Narval such that positive Q corresponds to a linear polarization parallel to the direction of the celestial north at the position of the star. Above and below, the left plot shows the observed Stokes Q and U profiles summed for the full spectral mask (blue and red dots respectively), as well as the fit produced by the inversion algorithm (full lines). The black line shows the intensity line profile for reference. The dashed vertical lines indicate the adopted values of V* (redshifted one) and Vmax (blueshifted one). The center and right plots show the Stokes Q and U signals respectively, for each one of the masks grouping atomic lines of the spectra of Betelgeuse in terms of the depth of the line profile, from 0.4 to 1 in ranges of 0.1.
Current usage metrics show cumulative count of Article Views (full-text article views including HTML views, PDF and ePub downloads, according to the available data) and Abstracts Views on Vision4Press platform.
Data correspond to usage on the plateform after 2015. The current usage metrics is available 48-96 hours after online publication and is updated daily on week days.
Initial download of the metrics may take a while.