Open Access
Fig. A.1
Download original image
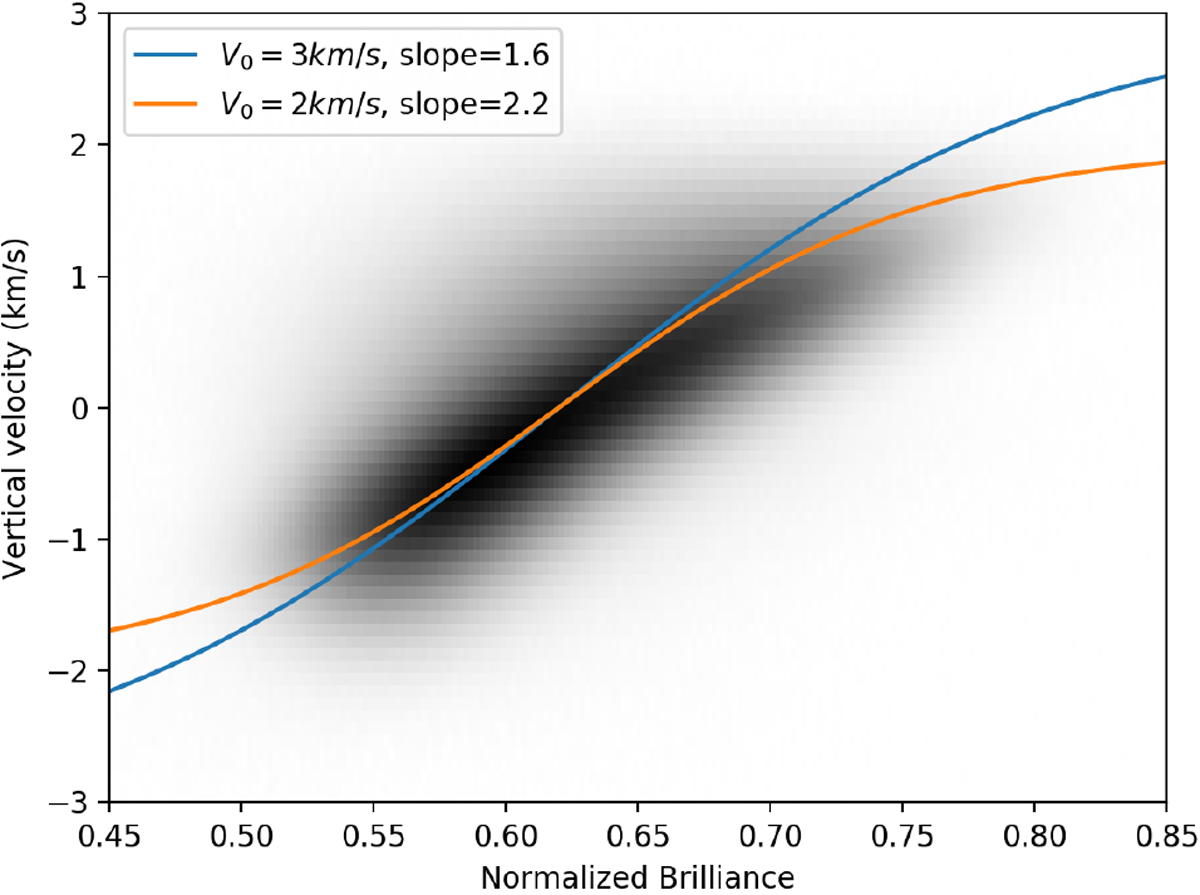
Histogram of pairs of values of radial velocity and relative intensity in the solar granulation using a dataset observed by Hinode (Malherbe et al. 2012). Two hyperbolic tangents are plotted over the histogram to illustrate how this function can capture the relationship between the two observables.
Current usage metrics show cumulative count of Article Views (full-text article views including HTML views, PDF and ePub downloads, according to the available data) and Abstracts Views on Vision4Press platform.
Data correspond to usage on the plateform after 2015. The current usage metrics is available 48-96 hours after online publication and is updated daily on week days.
Initial download of the metrics may take a while.