Fig. 1
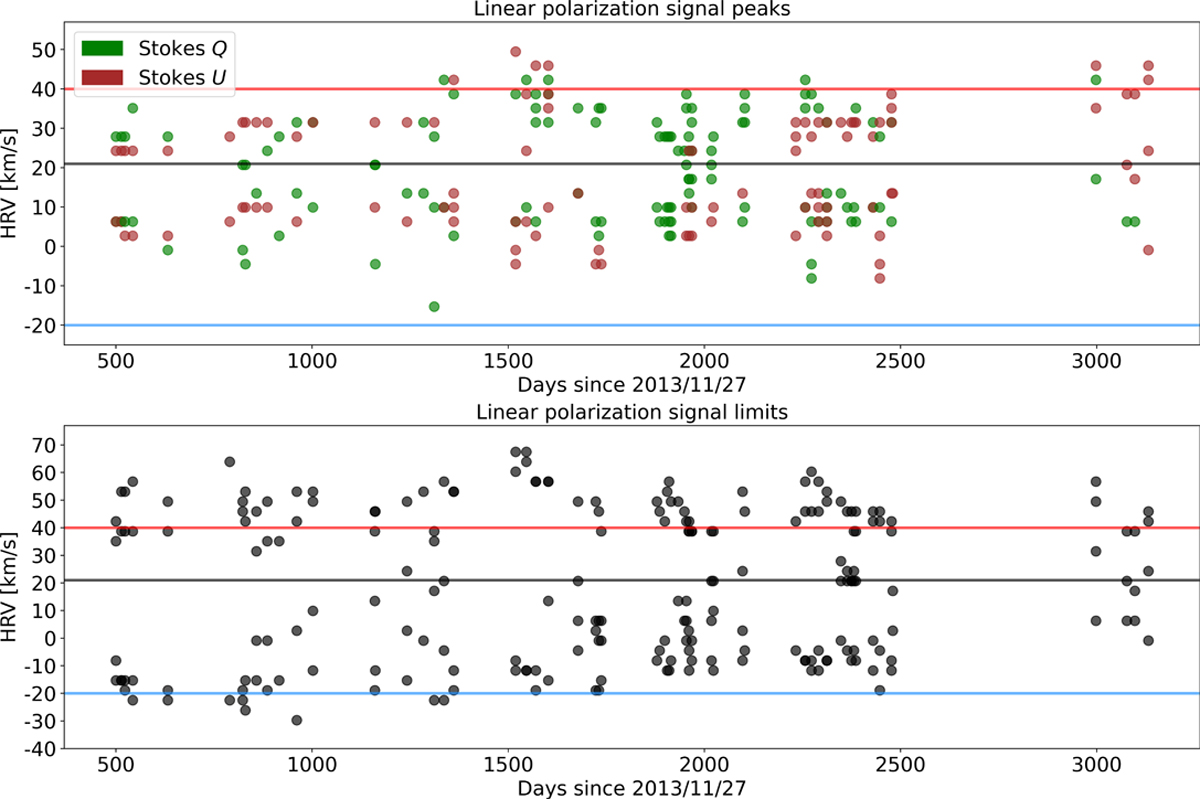
Download original image
Determination of the position of the observed peaks in polarization (top) and the maximum wavelength at which signal is still above noise (bottom) for all the data available since 2013. The gray horizontal line marks the average wavelength of the intensity line center. The blue and red lines mark the chosen values of Vmax = 60 kms−1 and V* = 40 kms−1 respectively. Wavelengths are given in kms−1 in the barycentric reference. Neo-Narval data start from day 2700. Noise is defined and measured as the standard deviation of the polarization signal at wavelengths beyond 100 km s−1 of the center of the spectral line. Typical noise values are below 10−4 of the continuum intensity.
Current usage metrics show cumulative count of Article Views (full-text article views including HTML views, PDF and ePub downloads, according to the available data) and Abstracts Views on Vision4Press platform.
Data correspond to usage on the plateform after 2015. The current usage metrics is available 48-96 hours after online publication and is updated daily on week days.
Initial download of the metrics may take a while.