Free Access
Fig. 4
Download original image
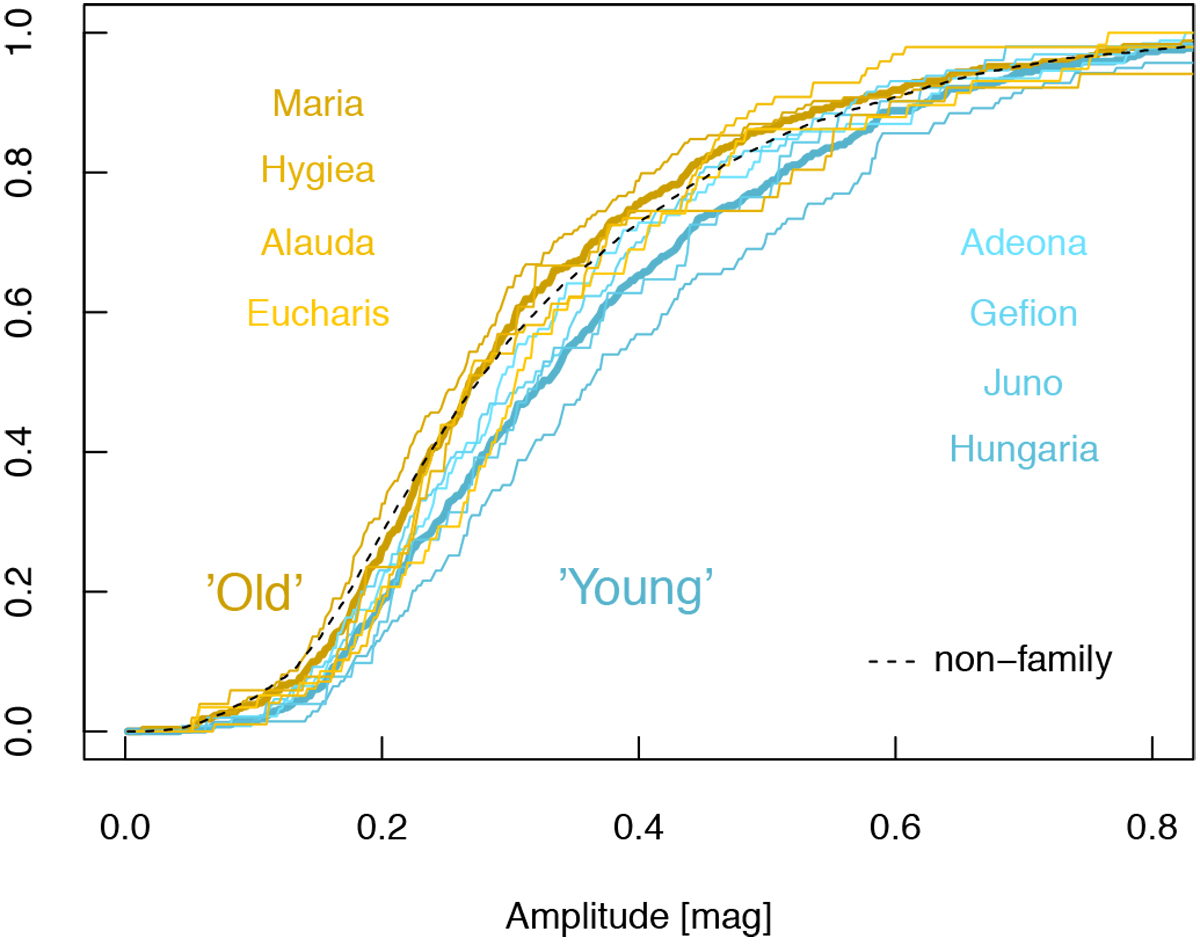
Amplitude distribution in four old families (thin brownish lines) and in four young families (thin blue lines). The lowermost blue curve is for the Hungaria family. The thick lines show the amplitude distribution in the young and old groups together. The black dashed line represents the non-family asteroids.
Current usage metrics show cumulative count of Article Views (full-text article views including HTML views, PDF and ePub downloads, according to the available data) and Abstracts Views on Vision4Press platform.
Data correspond to usage on the plateform after 2015. The current usage metrics is available 48-96 hours after online publication and is updated daily on week days.
Initial download of the metrics may take a while.