Fig. 8
Download original image
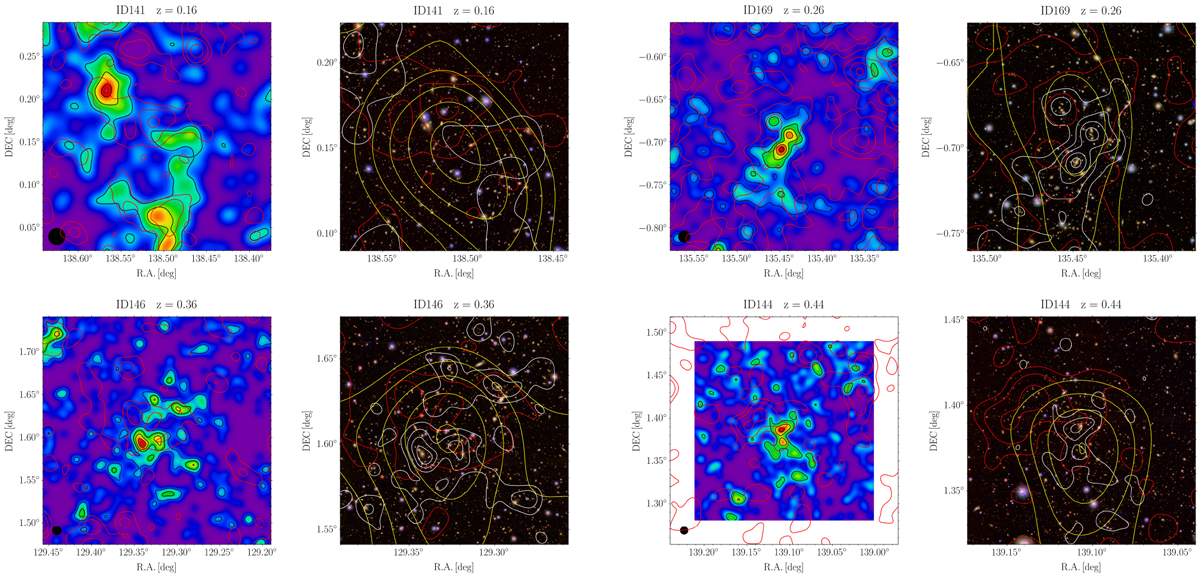
Left: galaxy density maps (16 × 16 arcmin) centred on the HSC shear-selected cluster positions without an eFEDS match. Overlaid in red are X-ray contours, which were obtained by smoothing the raw X-ray image in the 0.5–2.0 keV energy band with a Gaussian of 24 arcsec. The black circles in the lower-left corners show the smoothing scale, FWHM = 200 kpc. Right: HSC-SSP optical images centred on the HSC shear-selected cluster positions. The 8 x 8 arcmin optical images of the central region are created using the z, i, and r bands. X-ray contours are shown in red, galaxy density contours in white (they are the same contours as the black ones in the corresponding galaxy density maps), and weak-lensing mass contours in yellow.
Current usage metrics show cumulative count of Article Views (full-text article views including HTML views, PDF and ePub downloads, according to the available data) and Abstracts Views on Vision4Press platform.
Data correspond to usage on the plateform after 2015. The current usage metrics is available 48-96 hours after online publication and is updated daily on week days.
Initial download of the metrics may take a while.