Fig. 7
Download original image
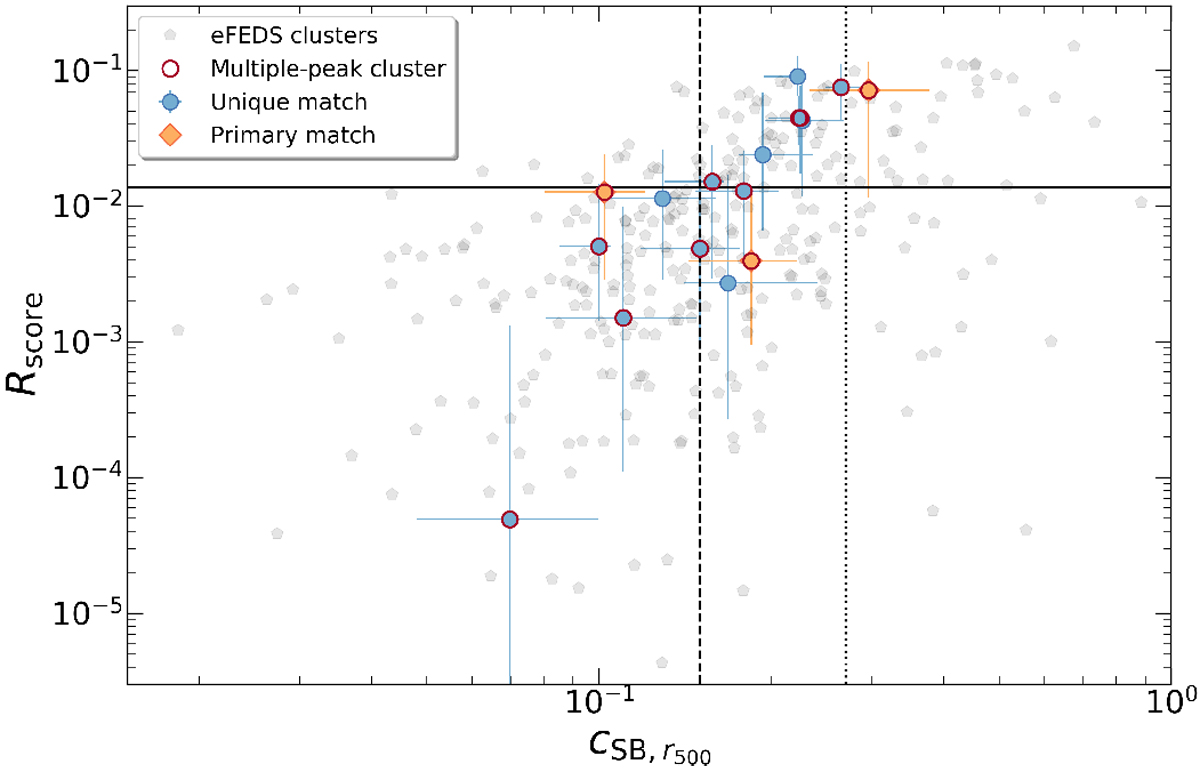
Relaxation parameter, Rscore, as function of the concentration parameter, CSB,r500. Filled-blue circles show the shear-selected clusters with a unique eFEDS match; filled-orange diamonds display weak-lensing peaks with a primary eFEDS counterpart. Points with a red ring around are clusters with multiple-peaks, which were found by peak-finding method described in Sect. 4.3.2. The solid black line indicates the threshold to distinguish relaxed clusters (above) from disturbed (below) clusters as suggested in Ghirardini et al. (2022), while the dashed and dotted vertical lines display a similar criteria suggested by Lovisari et al. (2017). Errors in the eFEDS clusters are omitted for clarity purposes.
Current usage metrics show cumulative count of Article Views (full-text article views including HTML views, PDF and ePub downloads, according to the available data) and Abstracts Views on Vision4Press platform.
Data correspond to usage on the plateform after 2015. The current usage metrics is available 48-96 hours after online publication and is updated daily on week days.
Initial download of the metrics may take a while.