Fig. 6
Download original image
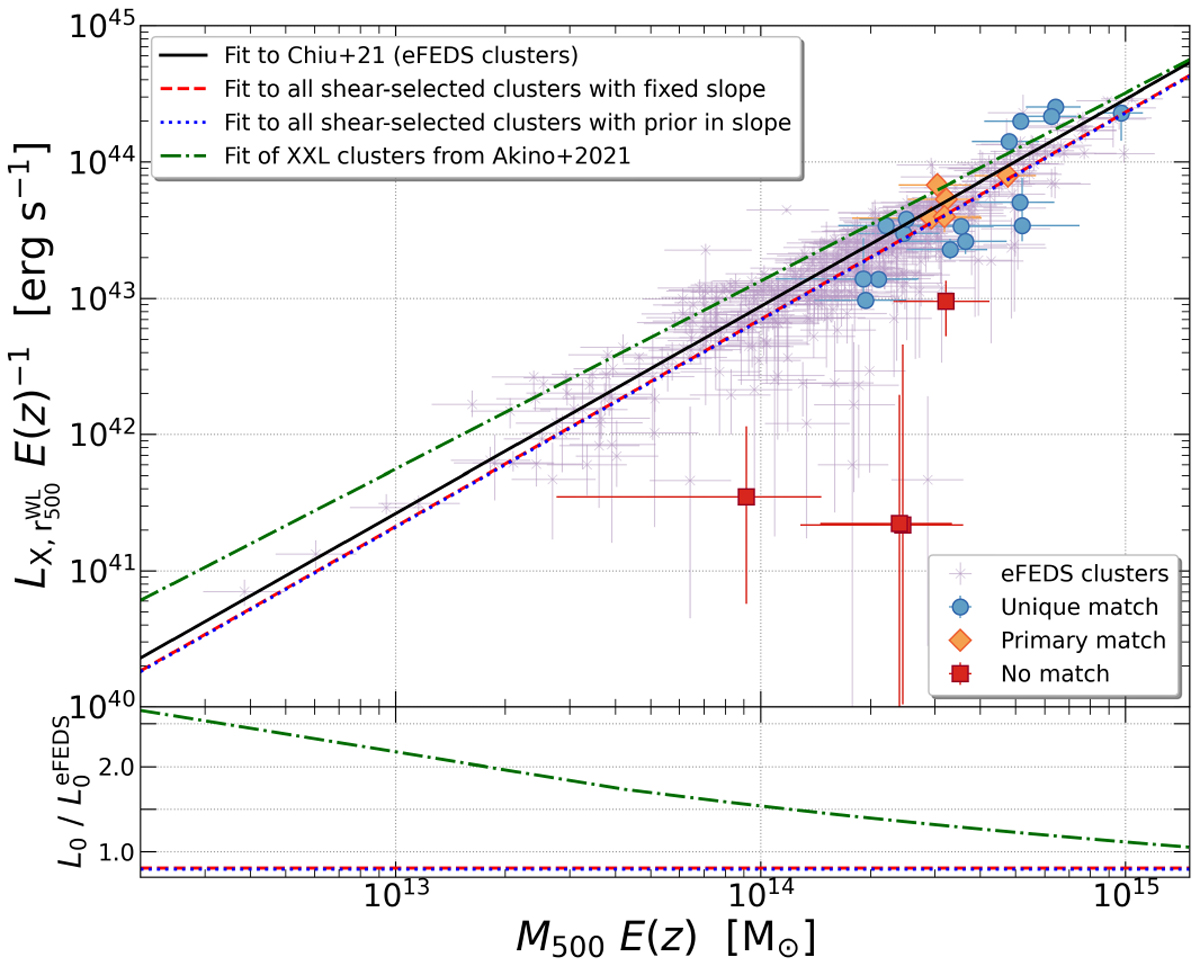
X-ray soft band luminosity–mass relation for the weak-lensing peaks in the eFEDS footprint. Blue circles show the shear-selected clusters with a unique eFEDS match; orange diamonds display weak-lensing peaks with a primary eFEDS counterpart; and red squares show weak-lensing clusters with no eFEDS match. eFEDS clusters are displayed as purple asterisks and its corresponding fit is given by the black solid line. Two fits, with fixed slope and with a prior in the slope, for the shear-selected clusters are shown by the red dashed and blue dotted lines, respectively. For comparison, the fit obtained by Akino et al. (2022) on the XXL clusters is shown by the green dotted-dashed line.
Current usage metrics show cumulative count of Article Views (full-text article views including HTML views, PDF and ePub downloads, according to the available data) and Abstracts Views on Vision4Press platform.
Data correspond to usage on the plateform after 2015. The current usage metrics is available 48-96 hours after online publication and is updated daily on week days.
Initial download of the metrics may take a while.